Trading trigger - buy signal.
Analysis - long term sell the rips, we have major top. Intermediate term - lower until late January/early February.
P.S. - for a trade both analysis and trigger should point in the same direction.

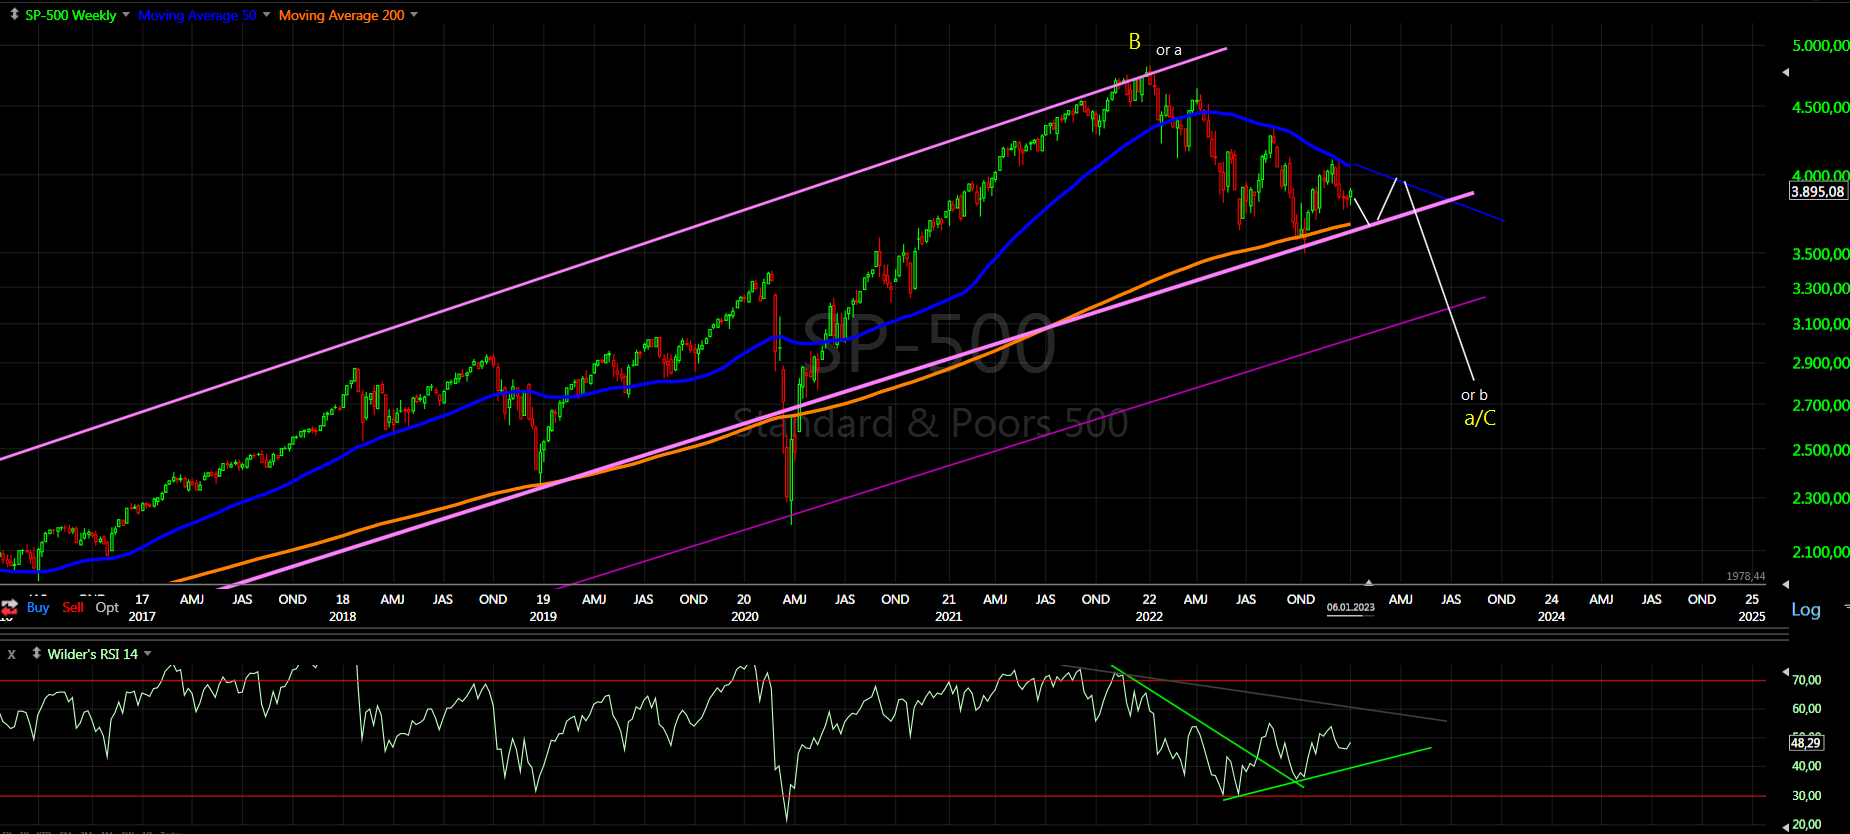
TECHNICAL PICTURE and ELLIOTT WAVES
Short term - this should be the c-wave for the pattern higher.

Intermediate term - the pattern is not clear at the moment, I am watching this two options. The last leg up is choppy it fits as c/B of a triangle or a/B of a flat, so far the current leg lower is too slow and choppy for reversal so d/B or b/B.

Long term - most likely huge double zig-zag from the 2009 low B-wave was completed and multi year decline has started. If we are lucky it is lower degree b-wave.
MARKET BREADTH INDICATORS
Market Breadth Indicators - turned higher, I think for a short term high and not a reversal.
McClellan Oscillator - above zero.
McClellan Summation Index - buy signal.
Weekly Stochastic of the Summation Index - sell signal.
Bullish Percentage - turned up, in the middle of the range.
Percent of Stocks above MA50 - turned up.
Fear Indicator VIX - there is no much fear... some sideways mess.
Advance-Decline Issues - moving higher.
HURST CYCLES
Short term cycles - not very clear...
The highs - too long for 5w high too short for 10w high - a guess the next 20w high will consist of three longer 5w cycles.
The lows - I think currently in the final 5w cycle. The 20w cycle looks like the previous one no clear 10w low... maybe three longer 5w cycles too.

Week 12 for the 20w cycle.... it will be strange if see reversal higher instead of a few weeks lower to complete the cycle.
The most obvious 18m low is in October - this will fit with flat B-wave. I have the suspicion it could have been in June - this will fit with triangle B-wave.

Good stuff Krasi, thank you. Put call ratios are near recent lows.
ReplyDeleteHi Krasi, it is starting to look like reversal higher. What do you think?
ReplyDeleteIt starts looking like a top of higher degree 10w cycle high, but nothing to suggest reversal. Still the same choppy corrective wave taking longer than the decline and retracing less than 50% so far - classical b-wave.
DeleteSo 1-2 weeks more for 10w high and then go down 2-3 weeks for 20w low?
DeleteAround 4200 for 10w high and around 3600 for 20w low?
DeleteI doubt it will take so much time and price.... rather the turn lower should be imminent.
DeleteAnd 22 December 10w low
ReplyDeleteYes, if we stick to the theory this should be the 10w low.
DeleteThis market is too strong. Should rise another 500 from here on Nasdaq. What do you think?
ReplyDeleteI think that a lot of fantasy is needed to see strength. Overbought indicators and price not taking out the previous high(in fact retracing just 50%) is weakness not strength.
DeleteYardeni: "We're back in a bull market".
ReplyDeleteI do not know who the guy is and I do not care.... wild guess just another wall street asshole selling bullshit.
DeleteI saw it somewhere yesterday, I will try to quote it... it summarizes such wall street "analysts":
"Tell lies to those who want to be lied and you will be rich.
Tell truth to those who want to hear the truth and you will make a living.
Tell truth to those who want to be lied and you will go broke."
Wall street is in the business of selling bullshit.
I just posted Yardeni's "take" as an example of a comedic interpretation of the current market conditions, and not as a counter/refutal of your hard work, Krasi. Next time I will follow similar with an "LOL", smiley face, or other indication of my tongue and cheek posting(s).
Delete"... tongue-in-cheek ..."
DeleteU.S. CPI tomorrow at 8:30am EST. This has been the biggest market moving data point of late. Either we break down or break out hard after that. Be careful with your risk exposure going into that release. I believe the market has been ripping higher in anticipation of it this past week, so hopefully a lot less upside than downside from these levels.
ReplyDeleteI have said it many times - news does not matter and this time is not different.
DeleteWhat hapend the last time with the bullish cpi numbers? Wall street sold the bullshit to those who want to believe it.
The last CPI print, S&P futures rallied >100pts in seconds and then gave most of it back during the day, that's more than a 6% intraday move. It was also the day the S&P marked an interim high and reversal/short term top. I was just curious to see if tomorrow fits with your timing of a reversal lower. Thank you
DeleteOne month from the last high so minimum 5w high, more likely 10w high.
DeleteProbably it will play out differently, but at the end it will be the same - sell the news.
Thank you for the answer and sharing your work!
ReplyDeleteI don't disagree with your analysis but don't you see bullishness in the market, at least based on RSI divergence in several places? US02Y has declined and risk assets like ARKK and Bitcoin are on the run.
ReplyDeleteAre you primarily because because 20w cycle hasn't completed?
There is nothing bullish, nothing more than corrections. The 4y cycle points lower that is all you need to know.
DeleteWould you mind commenting on the european indices?
ReplyDeleteClearly outperforming and the structure looks more bullish compared to us markets.
Thanks,
B-wave should be completing then we should see C-wave - https://invst.ly/-04br
DeleteThanks a lot!
DeleteWhat a mess if we see a reversal in the next few days and January goes flat or red…
I guess it should coincide with a turn in DXY.
Krasi, bullish divergence in nyad cumulative from December 2022.
ReplyDeletehttps://stockcharts.com/h-sc/ui?s=%24NYAD&p=D&yr=1&mn=6&dy=0&id=p02664424636
It is not a divergence there is now lower low to diverge something, it just shows it is maybe top of a higher degree.
Deleteit looks like 10w high but from August are 20 weeks, maybe 20w high?
ReplyDeleteIt is possible .... see the chart above the DAX - in this case this could be even 18m high.
Delete