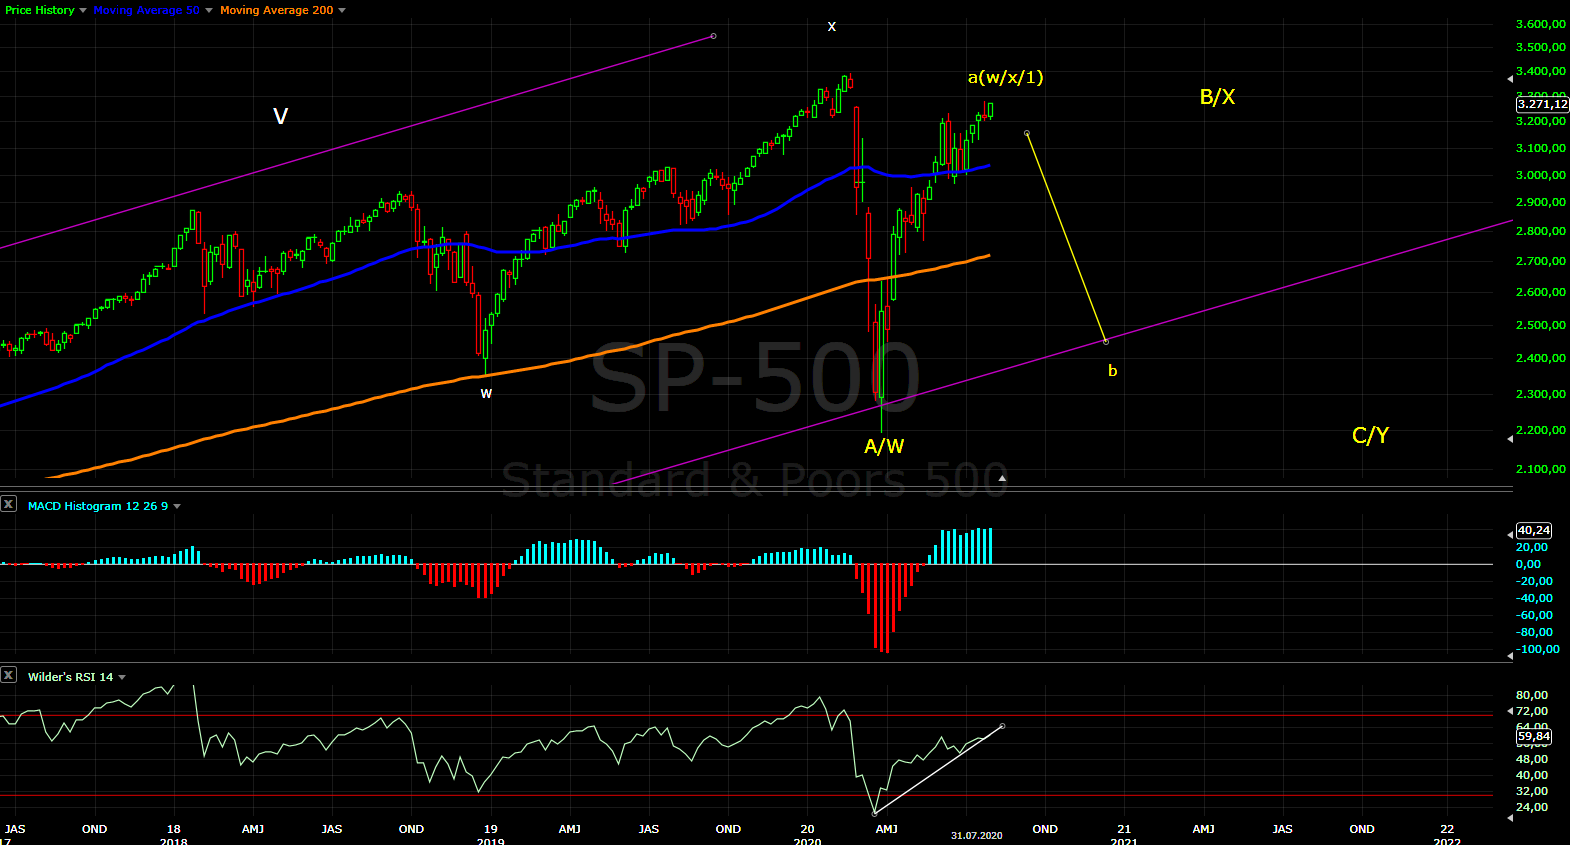
Make a step back and look at the chart - from the lows in June we have clear corrective pattern choppy mess no need to be EW expert. So what options do we have with corrective pattern? - it is some b/x wave, but the decline is missing.... the other option - corrective advance means some kind of ED(two versions shown below) to complete the rally from the March low. This is the primary scenario now - in the next few weeks the rally from March should complete with ED. Time - possible 20w low late June or if we see a decline next week this could be the 20w low. TRADING
Trading cycle - the price is oscillating around MA10 in a tight range so the signal is neutral. Nothing to trade is a signal too. I do not see neither reversal nor completed pattern from the March low so waiting is the best option.
With 24 trading days probably at 5w Hurst cycle low.

TECHNICAL PICTURE and ELLIOTT WAVES
Short term - one possible count a-b-c with c ED for Z... I am not a big fan of such complex triple corrections, but this will work with DJ for example. If we see one more decline next week for a bigger corrective pattern(yellow) the other version of ED will look better - see the daily chart.

Intermediate term - a-b-c with c ending diagonal looks much better than triple correction wxyxz, but it does not work for DJ or NYSE for example.

Long term - I think the bull market completed in 2018. Since then a bunch of corrective waves. Currently watching this pattern... but with corrective waves often you have to adjust so stay open minded. Main scenario is now wave a and wave b starting soon and moving lower into 40w low November/December. It could be b of a flat or triangle. With corrective zig-zag there is always alternate scenarios - zig-zag W wave for combination, zig-zag X wave and the next decline begins, zig-zag wave 1 for ED. The first most likely and the last one ED the least likely.
MARKET BREADTH INDICATORS
Market Breadth Indicators - still negative pointing lower and not following the market.
McClellan Oscillator - below zero.
McClellan Summation Index - divergence and turning lower.
Weekly Stochastic of the Summation Index - turned up probably because we should see 2-3 weeks higher.
Bullish Percentage - divergence and turned lower.
Percent of Stocks above MA50 - divergence and turned lower.
Fear Indicator VIX - the same lows for almost 2 months.
Advance-Decline Issues - divergence and turned lower.
HURST CYCLES
Short term cycles - possible 5w low this week or a few days lower next week for 5w low... difficult to say.

Week 5 or 19 for the 20w cycle.... waiting to see what will happen next week. It will be nice to see one more decline next week it will count better. Even if it is not very deep it will be enough - dominant 40 week cycle with bell shape and not very well visible 20w low. The previous one was such with shallow and short low in January.

With the stocastic summatiob index you mean 2-3 weeeks higher from now or from the 5w low the next week?
ReplyDeleteFrom now... not that a few days make a big difference for weekly indicator.
DeleteSP500 is much stronger so this indicator should hit overbought level in the next few weeks with possible divergence and turn lower again.
https://stockcharts.com/h-sc/ui?s=%21MCSUMRSPX&p=W&yr=1&mn=6&dy=0&id=p91082501712
Thanks Krasi. I'm thinking NQ makes a higher low which the other indices makes a lower low around mid week before we have the final rally into mid-Aug. Then it should be down until election. After election we should have the next rally.
ReplyDeleteThis is my plan too....
DeleteNow it does seems like the 5w low is behind us for all the indices. Momo is still up whether we like it or not. The last 5w cycle wasn't too weak. Now the difficult question to answer is where do we top, or how much more strength does this 10w has?
DeleteLooking the tech sector I would guess around one week.
DeleteCall me crazy but I believe last Thursday (July 30th) was the 20 week low! If true it projects the next and final 20/40 week low late November or very early December. The current rally from last Thursday should be short lived. Comments are welcome as always. Thank you for all your work Krasi.
ReplyDeleteJP
!
It is not so crazy the indices are heading into 40w cycle high so we have somewhere 20w low, but I think 29 June looks better... this 6 days are too short and shallow probably 5w less likely 10w low.
DeleteIt will be perfect if we see a few days higher to complete 3/c for the ED and 10w high, then a 1-1,5 week lower for 4/c and 10w low and final move up 5/c and 20w/40w high.
It should take several weeks.
Thank you. Possible we shall see. In any case the market is about to have a blast with the coming elections. It's about to get very interesting..
DeleteAnother week another touch of this damn trendline https://invst.ly/rnvjh Wen sell?
ReplyDeleteWhen the most give up and embrace up forever:)
Deleteah! that could be years!
DeleteYeah NQ likely peaking soon here then down into end of the week or beginning next week and then the final bounce. However YM and RTY had just started the 5w, so it may hang up here a bit longer. We'll see. However the counts looks full and I don't think there's much wiggle room on the upside.
ReplyDeleteI think at least this to complete an impulse - ttps://invst.ly/ro63k
DeleteCorrection will start today... Watch out below.
ReplyDeletehttps://www.tradingview.com/chart/DJI/2He6v9HG-DJA-weekly-chart-with-target-down-more-than-11/
SP500daytrader
I am skeptical too much unfinished business everywhere - AAPL/NDX, Dj, crude oil, USD. They all need pullback and higher with divergences.... at least a few days before a high.
DeleteI thnk at least a-b-c should be completed - https://invst.ly/ro62o
AAPL candle from yesterday looks good for bears, but who knows
ReplyDeleteBut intraday looks like 4th wave.
DeleteFinally divergence on the daily in gold, but is it enough?
ReplyDeleteI would say more patience RSI a lot of strength and far away from MA50. It will take time to clear this two conditions before thinking for something lower.
DeleteHas it not gone parabolic at this stage. Monthly RSi is crazy! How far more could it go!
Deletetrendline saying 3310-ish may be the target today https://invst.ly/rocxq
ReplyDeleteHi Krasi, when there is so much liquidity in the system due to the fed actions and when everyone's bank accounts are so loaded with cash (m1 money supply?) Why don't you think that indexes (other than ndx) will hit ATHs?
ReplyDeleteJust look at XLF or NYSE chart and you will see why.
DeleteHow much liquidity there is in the system is nothing more than a guess. And what will it cause is just a personal perception. It is much more simple to look at a chart instead of guessing and making assumptions.
When there is so much liquidity why did we saw 30% decline?
Yes, you have a point. I think the bloated valuations of the tech stocks shrouds my thinking. PEs have jumped 50-100% from what they used to be and the parabolic moves just don't correct. At some point you think its done and then the stock goes up another 50%. :-) May be this is just bull market euphoria and not always a direct result of the liquidity.
DeleteThere is always an excuse for the euphoria this time is the FED.
DeleteAnd the result it is always the same - the reality strike back.
What is on the other side of the liquidity equation? It is much bigger and FED can not stop it.
WHat happened to you're other count where you showed a corrective drop than rally to a new high? From what I see now, it's just a drop that will retest March lows you are showing.
ReplyDeleteAll corrective waves. The bull market is over. If we see a new high it will be part of corrective wave like 2019.
DeleteSo do you see one final big drop from here? or another pullback that goes on to make new highs?
DeleteI meant to ask this before. Why does it matter if its a corrective wave or otherwise if its going to new high? I can guess the answer. Is it that corrective moves up are not sustainable whereas a non-corrective up momentum is sustainable for a longer term?
DeleteAnonymous - the final big drop will come later 2022(4y high) to 2024(4y low). Until then the corrective pattern will continue to develop. At the moment I can not say if the move from the March low is completed or not. If not it can make ATH before declining into 40w cycle low.
DeleteVB - the corrective moves are fully retraced... last example one year great gains evaporated for a month. How many did take profits and how many were waiting because the market never goes down? In hindsight which is better accept the reality it is corrective move and take profits at 3200 or even 3000 or watch everything evaporating? What is the point holding from 3200 to.... 3200?
I understand that the structure is corrective since 2018. How do you predict that such behavior will continue until 2024? Is it because these cycles are ~4 years in duration?
DeleteWe done with Z yet
ReplyDeleteKrasi- nasdaq target still 11,600?
ReplyDeleteNot sure if we saw iii/5 or v/5 today.
DeleteAnother wave up Krasi?
ReplyDeleteNo
DeleteNext is the bye bye wave 😂
ReplyDeleteNext is weeks of slowly going higher. Happened last time as well. Looks like it will be the same with gold.
DeleteOr it is making 10w high and it will move lower for a few weeks.
DeleteThe crash starts today, after lunch (1:30 pm NY time)
ReplyDeleteNow it is possible...
DeleteKrasi, can the move in SPX since March low be counted as 5 waves up LD?
ReplyDeleteI can not see LD.
Deletehttp://studyofcycles.blogspot.com/2020/08/little-doubt-of-fifth-wave-up-2.html?m=1
DeleteThe guy is digging so much in his theories degree violations etc and this is the result.... this w4 of his LD is real joke compared with w1, but he is explaining about degree violations.
DeleteHere is my test show me another index with this pattern - one big zero.
The pattern failed the ultimate test. There is no such thing like SP500 makes one pattern and all other indices something else.
Nq leading. Monthly charts of tech stocks look like a fireworks show right before the explosion
ReplyDeleteActually looks like SPY about to head a little higher to test prior high as Nasdaq made a reversal at the end of the day and will rise and form a b wave before the fall. The moves are very choppy and no definable stable trend either up or down. This market will surprise us at every turn. I am trading 5 min at a time.
ReplyDeleteGood luck,
Kali
Do Elliott Wave followers make money in the market or do they just indulge in philosophical speculation? Asking seriously.
ReplyDeleteI can not make a survey and I do not have statistics so I can not tell you.
DeletePersonally I switched for trading decisions to something else - the first chart.
Which does not mean EW is useless - good example is this year. Question to you how many which does not use EW expected 30% lower?
That's a good point. I feel like EW gets some major long-term calls right but shorter term it's easier to use simple technical analysis.
DeleteThis is for sure it is easy to call corrective move but 90% of the cases you can not say how exactly it will look like.
DeleteI am using the most simple technical analysis for trading trigger and the big pattern to decide is it worth or not the trade.
That makes sense. It's very interesting and the March call was very good. I have just found it frustrating sometimes. Maybe it's because I have let the big picture influence my short term trades. But I'm getting better at differentiating. Thanks for your work!
Delete