I am taking a break for two weeks. The next weekly update will be on 6th of Mai... probably I will post a short update on 2/3th of Mai.
I do not expect dramatic changes... the "surprise" could be if the correction is finished in the next two weeks which is the short end of this time frame which I am counting currently at 2-4 weeks, so not really a surprise.
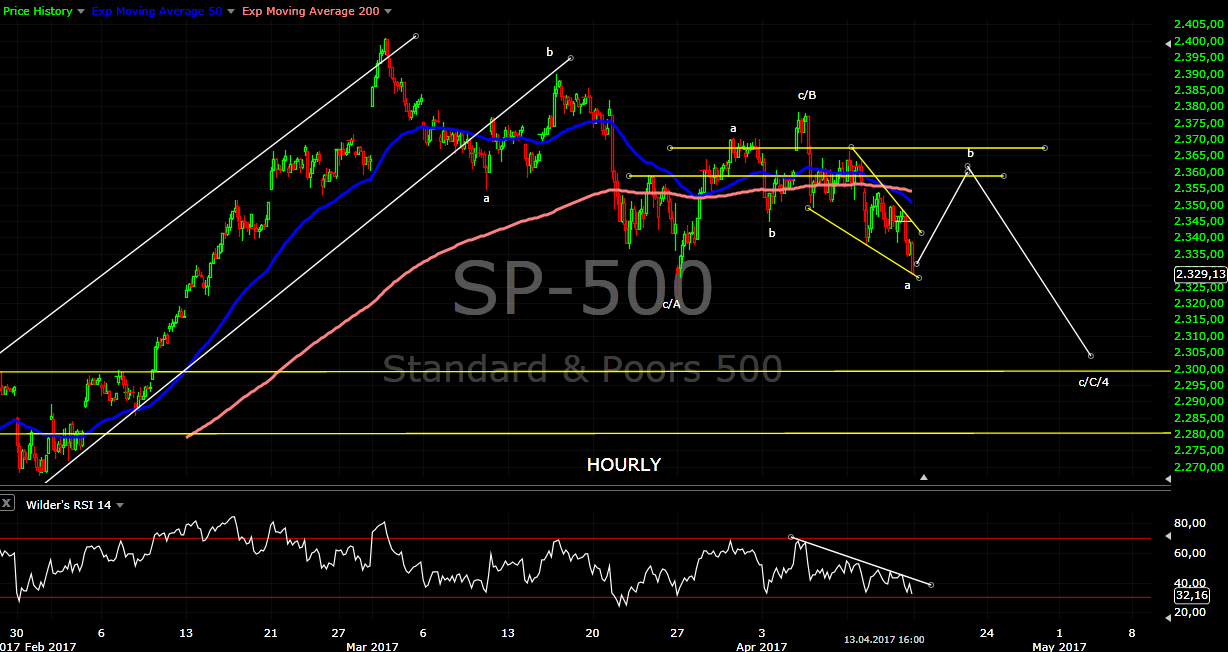
It is like in November, it is a correction - constantly changing short term moves and a lot of combinations possible. I have shown below two options. There is at least other two scenarios - wave d of a triangle which suggest the same higher, but the final leg lower will not make lower low or another scenario just plunging lower. I think it is more likely to see mid-cycle low of the 40 day cycle instead of a plunge and I would like to see a fear for the last leg lower so I show the scenarios which I prefer.
Some would say not very helpful so many options... I would say if you focus on following the moves on short term basis you are missing the important messages. The important messages is - it is a correction and after a correction another rally follows. The exact shape of the correction is info just for the statistic.
The price action seems to confirm my analysis - the move lower will last at least 9-10 weeks(important cycle low expected 18 month) and at week 7 we have 3-4 possible patterns which means this is just a correction.
The wave lower is already running, some retracement to resistance/MA50/MA200 and final leg lower.

Flat correction for B and final leg lower C. If it is a triangle instead of B this is will be d and e to around 2330 instead of C/4

Hi krasi,
ReplyDeleteThis pattern of retracement looks like the biotech index this week! Looking forward to next week and happy Easter!
Kali
I think your April 11 chart is more likely..another rally coming imo .enjoy your time off
ReplyDeleteThere are many including Pritchard who claim wave 3 is behind us. Krasi has an interesting point of stating wave 3 still is not complete. They both have valid points but if Pritchard is correct, the retracement should be more than what's indicated. I guess we will see how things will unfold.
ReplyDeleteAbsolutely spot on
ReplyDeletewhat is spot on? that we are in wave4 still or that a wave5 has already started?
ReplyDeleteI would love to hear from Krasi - just a quick message update - no need for any charts. Thanks.
ReplyDelete@Raymond
ReplyDeleteSpot on it would have bounced back up to resistance level
sound like C/B is broken EW rule,pattern is changed
ReplyDeleteSP500 around 2389
ReplyDeletecould be a Head and shoulder forming
ReplyDeleteIt looks like it will be a flat correction.
ReplyDeleteCheers
Kali
It looks like v of 3. I do not think this rally will last very long... another week. This should be the third wave of v of 3 so higher than 2400, but not much higher.
ReplyDeleteThanks for the update. In this sense, the March down move of SPX is wave iv of 3 and this wave v was from march 27? and APR 13 is the wave (2) of v?
DeleteFlat is more likely for the reference index which I mentioned a few times - XLF.
ReplyDeleteClose to MA50 and the trend line with a-b-c for B.
The other indexes look like 1-2-3 and the indicators to at least few more days higher so more likely v of 3 for them.
In fact still in B for a flat do not look bad at all even with a higher high.
ReplyDeleteThe indicators and cycles suggest that this move should not last very long and this favors B.
Do you think GDXJ has been closed to bottom in the near terms (hourly, several days)? Thanks.
DeleteIn this time frame I think yes - one more lower low then several days higher.
DeleteThanks. Still one more lower low to $30/share or it has been yesterday last minute final low and now begin higher?
DeleteOne more low to 30-30,50
DeleteFinally see some top appears? thanks.
ReplyDeleteOne more high is needed, this is small wave iv from the last low.
DeleteIf you could Krasi when you arrive back if you would post your thoughts and chart on GDXJ. Hopefully, a big move lower to set the pace for a larger move higher.
ReplyDeleteWhat a gorgeous symmetry in GDXJ. WOW. Look at 12/2013 and 12/2016. Then look at 6/2013, 5/2014 and now. We bottom somewhere between 30-31 to start a 200% rally.
ReplyDeleteNot to mention symetrical tops as well around 50 and 43 USD...
DeleteIt is not a surprise miners have stable 12/24/48 week cycle. In summer there is a rally from the 24 week cycle low and in the end of the year from the 48 cycle low.
Delete