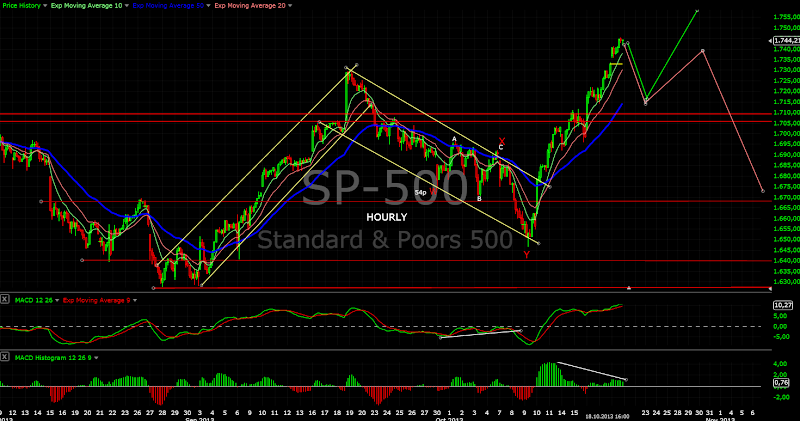
Short term view - pullback and than we will see what happens.
Intermediate term view - intermediate term trend is up, but I will be cautious with all this divergences.
Short living pullback and move higher as expected, so no surprises this week. After the "resolution" of the debt ceiling problem SP500 continued higher and touched the upper trend line of the wedge as I forecasted, but DJIA and DAX stalled the last two days printing bearish candles dragonfly doji and hanging man. That does not look very bullish to me...
For the next week I expected pullback and than we will see what happens. For the bearish scenario the indexes should start toping, for the bullish scenario 1-2 days pullback and another move higher.
Again I am leaning more to the bearish scenario because of cycles, divergences MACD daily and weekly, market breath indicators, history(see the weekly chart), but I am not calling top because it is the wrong way to trade in the long run. We know how a bearish or bullish move should look like and we will just follow the market. The discussions between bulls and bears in Internet are getting very hot:), the signals are bullish but be cautious a lot of red flags. Stay cool and just follow the market
TECHNICAL PICTURE
Short term - how the both scenarios should look like... the red scenario can make higher high, important is the move to be weak that is why this angle. Logical target for the pullback is support and MA50 around 1710.
- Triple cross(EMA10 and EMA20 crossing EMA50) - triple cross is positive, short term trend is up.
Intermediate term - pullback max 2-3 days for the trend to take a breath, before moving higher and negate the triple MACD divergence, or the bears will take control....
- Trend direction EMA50/MACD - the intermediate term trend is up, but be very cautious watch the MACD triple divergence.
- Momentum Histogram/RSI - momentum is up, short term trend is up.
Long term - The pattern is still intact, MACD is struggling not to break its trend line... the bulls should master strong rally to negate all divergences and the historical pattern.
- Trend direction EMA50/MACD - long term trend is up - the price above MA50 and MACD above zero.
- Momentum Histogram/RSI - momentum has turned up, the intermediate term trend is up.
MARKET BREADTH INDICATORS
The Market Breadth Indicators - look better now switching to buy signal, but the divergences are still there....
McClellan Oscillator - near to overbought levels and outside the BB... pullback expected.
McClellan Summation Index - buy signal, but still lower high
Weekly Stochastic of the Summation Index - still on sell
Bullish Percentage - buy signal, but lower high.
Percent of Stocks above MA50 - overbought....
Fear Indicator VXO - plunged lower... a looot of complacency again.
Advance-Decline Issues - I think we will see another lower high.
HURST CYCLES
Again both scenarios bullish we saw 20 week cycle low and bearish this was only 20 day cycle low and we should see another move lower.
The bullish scenario - the indexes should continue moving higher in the next 2-3 weeks at least.
The bearish scenario - the indexes should top next week and start moving sharply lower.
Tom Demark SEQUENTIAL AND COUNTDOWN - this technique spots areas of exhaustion.
Setup, combo and countdown very close to be completed.... This means to expect a short term top next week.
Setup at 6, the next two weeks will be compared with the two red candles and there is high probability to see at least 8 of the setup before a price flip even if SP500 does not make higher high.
Subscribe to:
Post Comments (Atom)


No comments:
Post a Comment