I have expected a red week, there we have it. The problem is the sell off was a little bit deeper and closed near to the lows for the week. Now we have second scenario which is equally probable.
Look at the first two charts - on the weekly chart we have bearish engulfing candle and the histogram has ticked lower. We have a double cross EMA5 is bellow MA20 for several weeks for the first time since the bottom March 2009. The prices are finding resistance at MA20 and are bellow it for several weeks. If DJ close lower next week and the candlestick is confirmed that will be very bearish.
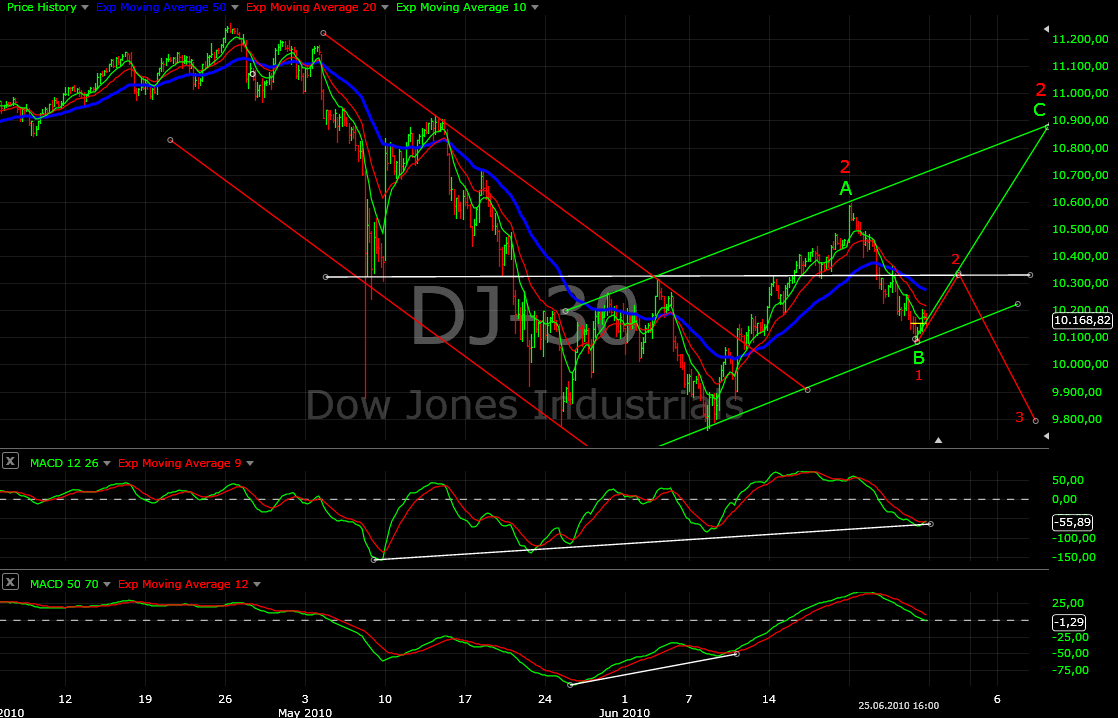
Look at the second chart - daily. The prices have reversed hard from the EMA50 and MACD curls over at the zero line. If DJ break the third trend line and the support level the bears will win the war.
On the bullish side - both DJ and DAX are still in the Up channels and looking at the market breadth indicators I do not think that the UP swing is over.
Short term I think we will have Up first to resistance ~10300 - look at the third and fourth chart - DJ hourly. MACD is bouncing of the trend line and the histogram closed above the zero line after divergence.
On the third chart you can see the both scenarios with the Elliot wave count - green the bullish one and with red the bearish one.
Lets see what the market will do next week. Watch the support and resistance levels.


DAX Weekly - the same story bearish engulfing candle, reverses for the second time at resistance. But DAX looks stronger then DJ - EMA5 is above MA20 and MA20 above EMA50. It is too early to get bearish.

Dax Daily - touching the lower trend line and closed above MA20

No comments:
Post a Comment