This week nothing happened... SPX500 made new highs, but DJIA not. I think the alternate scenario, which I have shown last week, will play out.
We are at an intermediate top, and we will see a correction at least 3 to 4 weeks.
Why? Look at the last two charts
- TRIN shows that the market is extremely overbought
- Put to Call Ratio shows that the traders are extremely bullish.
- Bullish percentage at 83%
- McClellan Summation index moving down
That are not indicators pointing to imminent rally. All this indicators are telling us that the risk is very high now. Every trader with common sense should not trade high risk, is not it?
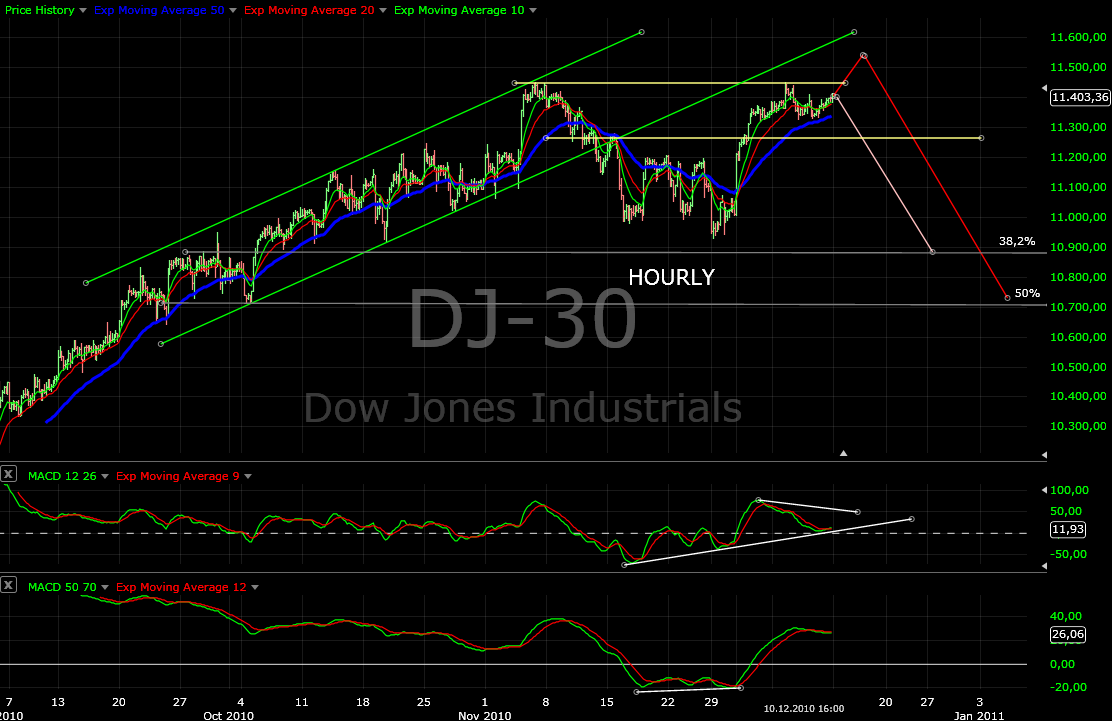
Look at the hourly chart MACD is at the zero line but turning up. A little bit higher prices for a day or two are possible, but that is all.
Even if we see a rise next week, we will have MACD/RSI divergence on the daily chart.(the second chart)
So I think in the next weeks we will see something like that shown on the charts bellow:


No comments:
Post a Comment