Short term view - Monday should be a red day.
Intermediate term view - One more leg lower to finish the correction.
The first part of the forecast played out - bottom and move higher to the 1860 area. Now I do not know who will win - the bulls or the bears. The index closed at 1864 leaving the door open for both scenarios. Momentum turned up, bullish weekly candle, the indicators favor the bullish scenario, but still have not confirmed 100% reversal... My preferred scenario is the bearish one, but I can not present you any evidence... except "it will look better":).
With that said bullish until proven wrong and we will work on our trading plan:)
First watch the price behavior for more clues:
If the move is really bullish(green scenario) it should continue higher or we can see a pullback. A pullback should be weak not lasting long - day, day and a half ideally testing 38,2% Fibo and MA50 hourly around 1850. It is allowed of course 1840(Fibo 50%) to be tested, but the move lower should be weak and choppy.
If the correction is about to resume(red scenario) we should see a strong impulsive move lower and on Monday we should see the price near to important support 1840.
My trading plan with focus low risk:
- If the price continue higher - hold the long position. Wait for a pullback to add longs/sell any shorts left.
- If we see weak move lower - wait for reversal higher and add longs/sell any shorts left.
- If we see strong push lower - wait for a bounce higher, probably from 1840, and when the price turns lower sell the long position and add shorts.
There is different strategies for different traders. For example more aggressive if you are an active trader and not afraid of risk, on Monday if the price moves lower you can sell the long position to book the profit and go short with tight stop above the high for the week. Than you see what happens and adjust your positions according the red/green scenario.
I hope the plan will work great like last week:)
TECHNICAL PICTURE
Short term - I think we will see a move lower on Monday and when we see how it moves lower we will decide to be more bullish or bearish.
- Triple cross(EMA10 and EMA20 crossing EMA50) - short term trend turned up.
Intermediate term - the middle trend line was tested as expected now we wait a day or two and see who is in charge - bulls or bears.
- Trend direction EMA50/MACD - intermediate term trend rtying to reverse... MACD is trying to turn up and move above the zero line.
- Momentum Histogram/RSI - momentum has turned up.
Long term - checked the targets for the Elliot waves and I think they confirm that after the current correction we should see one more leg up and important top.
I do not think that any move higher will clear the MACD divergence and start another long lasting rally. I think the next big move will be lower, but it could last months until we reach this point.
- Trend direction EMA50/MACD - the long term trend is up - the price above MA50 and MACD above zero. The MACD divergence should make you worry, that the long term trend is topping.
- Momentum Histogram/RSI - momentum ticked up... but it's too early to say that intermediate term trend turned up.
MARKET BREADTH INDICATORS
The Market Breadth Indicators - trying to turn up and confirm move higher... but too early for now.
McClellan Oscillator - moved above zero...
McClellan Summation Index - trying to turn up but still sell signal.
Weekly Stochastic of the Summation Index - trying to turn up but still sell signal.
Bullish Percentage - trying to turn up but still sell signal.
Percent of Stocks above MA50 - in the middle of the range no valuable information. One last move lower to 25 area to finish the correction will look nice:)
Fear Indicator VIX - complacency again... but as you know VIX at 13 is a buy:)
Advance-Decline Issues - in the middle of the range slightly above zero nothing interesting for now.
HURST CYCLES
One more leg lower to finish the second 40 day cycle... or a little bit extended 40 day cycle with length 48 days....
Week 11 of the 20 week cycle. Another 2 weeks lower probably.
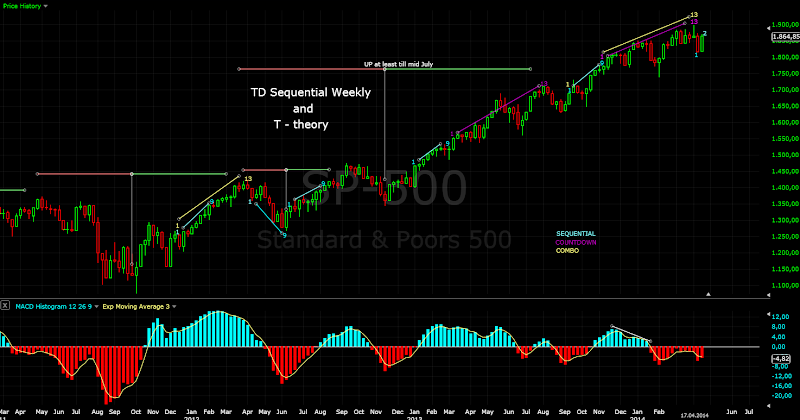
Tom Demark SEQUENTIAL AND COUNTDOWN - this technique spots areas of exhaustion.
Setup negated at day 9 and price flip higher.
No price flip for now at the weekly chart.
Subscribe to:
Post Comments (Atom)


No comments:
Post a Comment