Intermediate term view - the indexes should continue to levitate around the highs for a few weeks before turning lower for a few months.
Two days I am watching the charts and wondering what is the most probable outcome.... just to get more confused:) After the big red candle Nasdaq has a V-shape recovery and looks like impulse higher, RUT strong with higher high too but only with 3 waves so far, SP500/DJ the bottom was tested and only 3 waves higher so far. The usual correlations do not work... did you notice that the sell off was in all asset classes stocks,bonds,precious metals like 2008?
The indexes show different picture and correlations do not help either. With three waves lower and three waves higher there is many combinations. Cycles enough price action for 40 week cycle low, but it is not a problem to see it 2-3 weeks later. Market breadth - we should see move higher for a few weeks.
Short term - at the moment I think we should expect a move higher, but not so strong as the most think. The alternate scenario is a quick lower low with divergences before turning higher again.
Intermediate term - looking at the cycles I think the 18 month cycle is topping, but the indexes will levitate around he highs for a few weeks(the USA elections are in 6 weeks).
TECHNICAL PICTURE and ELLIOTT WAVES
Short term - to count this as an impulse the price should turn higher on Monday and continue drifting higher with series of iii-iv iii-iv to finish wave 3(green).
The price should stay above 2152 the break out and MA50. If we see it below this level we have only A-B-C (red).

Intermediate term - the down trend is still in tact - SP500 reversed from the trend line(DJ from MA50 daily), the oscillators too. The bulls need a breakout on Monday/Tuesday for something more bullish.
I am not sure what pattern we have... the obvious choice is wave 5 from ED, but I am not sure about that.

Long term - I am not sure for the bigger pattern... the obvious choice is wave 5 from ED(red), but I think the top of the bull market will come later not this year.

MARKET BREADTH INDICATORS
The Market Breadth Indicators - a move higher for a few weeks should be expected, but short term a quick push lower and reversal can not be excluded.
McClellan Oscillator - strong move higher should be confirmed with higher low.
McClellan Summation Index - retraced lower,but still too elevated for a long and strong rally.
Weekly Stochastic of the Summation Index - turning higher from oversold levels.
Bullish Percentage - still above 70 no signs of a strong sell signal.
Percent of Stocks above MA50 - in the middle of the range, could not hit 25... quick decline with divergences is possible.
Fear Indicator VIX - a lot of complacence... should start building divergences.
Advance-Decline Issues - in the middle of the range for two months... like the indexes moving nowhere.
HURST CYCLES
I am in the camp that the cycles for the SP500 are shorter than the nominal model so 11-12 for 20 week cycle low and 30-31 weeks for 40 week cycle low are enough for me. Waiting to pinpoint the lows EW does not help either so we will have to wait.

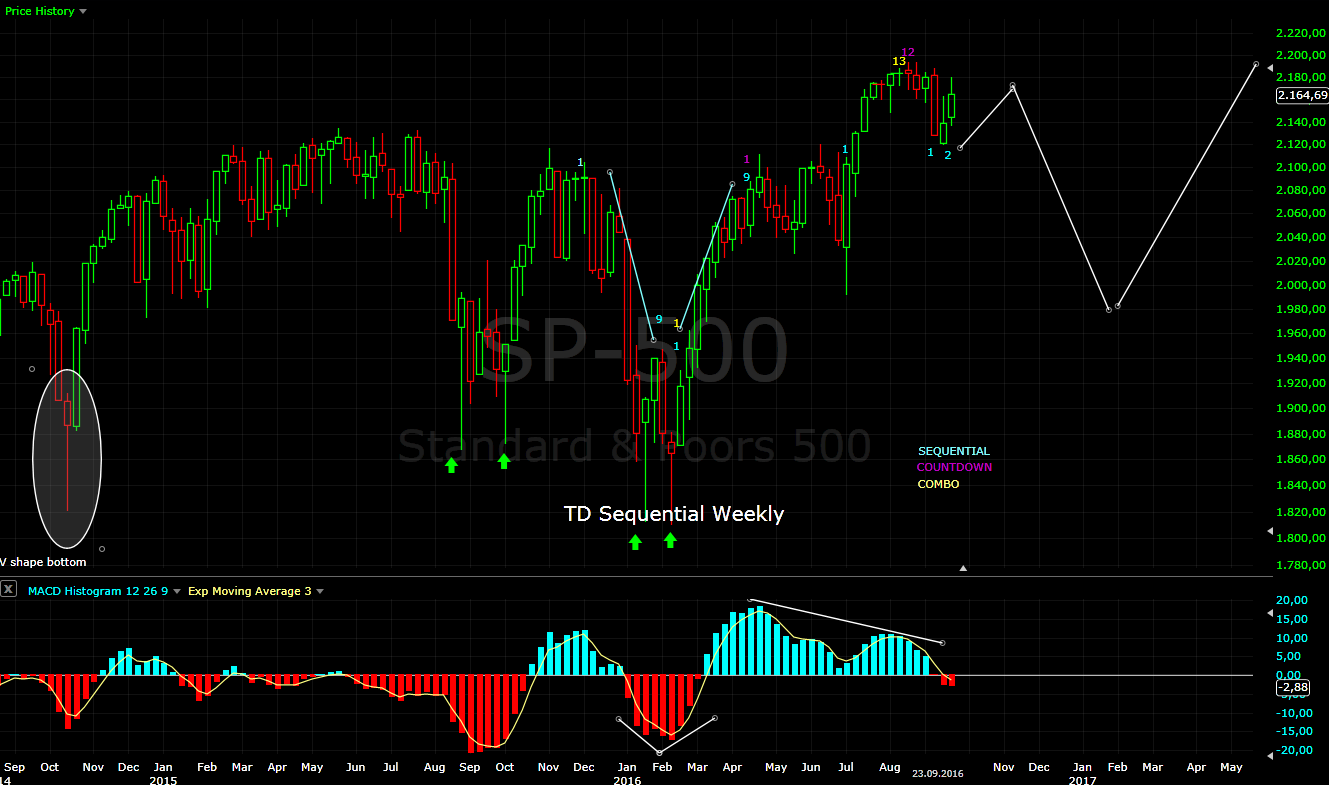
Tom Demark SEQUENTIAL AND COUNTDOWN - this technique spots areas of exhaustion.
Finished combo marked the first top. One more move higher to finish countdown for the second top will look great.
DAX looks like clear A-B-C from the February low. One more higher high for wave 5 of C and A=C will look great. If the DAX moves higher the US indexes should move higher too.

Isn't ED waves 3-3-3-3-3? But in intermediate sp500 u have 5-3-5-3..
ReplyDeleteExactly first this is LD and second there is no overlapping between wave 1 and 4 for SP500(but there is for DJ). That is why I say it is the obvious choice, but I do not really like it. I do not have other better looking pattern at the moment that is why I do not have any labels.
DeleteI think from February this is wave 1 of a much bigger ED, but it is just a speculation at the moment.
Than comes the practice and trading. First I have seen many times counts working if you are "creative" and not 100% compliant to theory. Second for trading it does not really matter the exact pattern. The next big move is lower and you do not hold longs because theory says so, you want to protect yourself. Later when we see the move lower we will know which pattern we have.
Thx Krasi, i think we are seeing iv and wavve 5 will be underway Tuesday/Wednesday.
ReplyDeleteI think we r seeing an expanded flat
One question: what software do you use for hurst analysis and can u recommend a good book! Thank you
Book - "Mastering Hurst Cycle Analysis" Christopher Grafton
DeleteSoftware - http://sentienttrader.com/ (it is not for free)
Analysis - https://www.youtube.com/user/SentientTraderVideo/videos
Blog - http://www.hurstcycles.com/
I do not use any software. I tested it, but I do not really need it. As with everything else I use only the basics. On the daily chart I count 30-50 trading days(80 day cycle) and on the weekly 13-18 weeks(20 week cycle) that is all. I look at the EW pattern and market breadth and decide if it is time for a bottom or not.
I do not use VTL, FLD interaction,composite lines,spectral analysis etc. All this is useful if you use only Hurst cycles for trading than you need software.
I think using the very basics of several technics and combining the analysis gives better result than being master of EW or cycles... and that is what I am doing.
Thank you Krasi! Your approach makes sense. I did watch his latest video (Thank you for the link) and his conclusions are similar to yours.
DeleteHi Krasi,
ReplyDeleteLooks like there are varying views of the short term action. But wouldn't nasdaq chart suggest current a-b-c move with the leg 5 behind us? I have been inclined to follow nasdaq as the leading indicator for short term action.
Thanks again,
Kali
Yes, too many options... the indexes show different picture I do not know which is leading. SP500/DJ the probability is higher that this a-b-c and not an impulse(what Nasdaq with finished 5 suggests). This will be confirmed if the price do not turn higher on Monday.
DeleteWith the current drop, I see potential for greater upside. Do you expect the markets to start rallying soon?
DeleteKali
I have the suspicion that we will see a diagonal higher that is why I wrote "we should expect a move higher, but not so strong as the most think"
DeleteSo far it looks good impulse lower, deep retracement next we should see b higher and c lower for 2.
Looks like we will be getting that reversal tomorrow for the "b".
ReplyDeleteKali
Kali or Krasi, can you draw a picture of what you are talking abt? What timeframe? Wave 2 on what timeframe? Thank you
ReplyDeleteIt is too early the pattern could change that is why I am not posting a chart.
DeleteWe are talking about that 12.09 was intermediate term bottom since than 1 higher and now 2 lower corrective waves so the pattern ending diagonal.... but as I said it could change, it is too early.
Krasi, the Nasdaq pattern working out perfectly :) what do you expect for the bottom of wave c on Nasdaq?
DeleteKali
If it continue to work simple a-b-c with a=c something around 4780-4790
Delete