Short term - I see corrective waves and I think it is wave b flat from the second leg lower. If I am wrong the indexes will just continue lower.

Intermediate term - I think the price will test one more time MA50 and the final sell off begins. Interesting is all three legs lower have the same size and I expect the same for the last one.
We have a transition from bullish to bearish mode(the same message from market breadth) - trending higher and bouncing up from MA200, transition phase breaking below it and testing it(failing to stay above it) next step is plunge lower and moving away from it.

Long term - intermediate term low expected in January below 2500 followed by multi month rally.

MARKET BREADTH INDICATORS
Market Breadth Indicators - turned lower most of them with sell signals - one more leg lower expected and divergences. This means the indexes switched from bullish to bearish mode. We had very oversold levels and instead of a rally we have a sideway move with market breadth staying at this oversold levels and divergence needed to see a more sustainable move up. This is behavior in bearish mode.
McClellan Oscillator - slightly oversold.
McClellan Summation Index - sell signal.
Weekly Stochastic of the Summation Index - sell signal.
Bullish Percentage - sell signal.
Percent of Stocks above MA50 - sell signal, close to oversold level.
Fear Indicator VIX - still elevated levels, but several lower highs, intermediate term low is expected in the next few weeks.
Advance-Decline Issues - turned lower and close to oversold levels.
HURST CYCLES
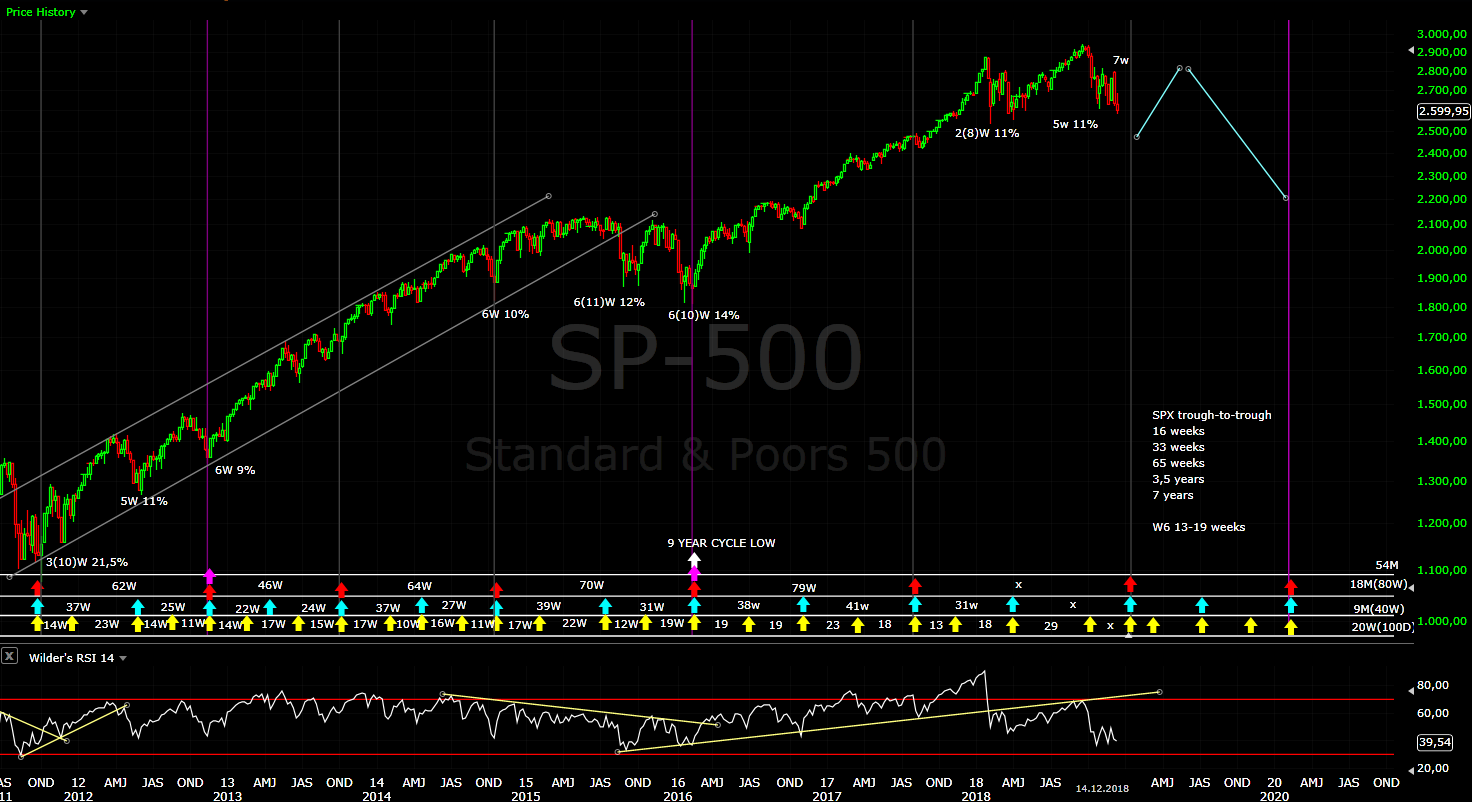
With one more low expected I have adjusted the cycle chart. I think we have one long 20 week cycle and currently a shorter one is running with a low expected in January for 18 month cycle low.
Day 28+4, with shorter cycle expected there is high probability that we have daily cycle low which fits with my expectations for a move lasting a little bit longer.

Week 7 for the 20 week cycle.
Tom Demark SEQUENTIAL AND COUNTDOWN - this technique spots areas of exhaustion.
We have the fourth sell off which fails to produce finished setup. My interpretation - the market is not trending lower, which means a lot of pain big sell offs, but it is a big correction and not a major top with impulsive reversal.

Hi Krasi .. have you considered descending triangles for Dow, S&P and Nasdaq? They all look similar.. but it would mean that the support line here would hold..
ReplyDeleteI do not think it is a triangle.
DeleteAfter today’s plunge it’s definitely not the case..
DeleteWell almost at my 2590 target ...will add to longs if it dips lower & avoids a crash monday ;)
ReplyDeleteBarring a major dip on monday , we should rally . Last 40 years data I have says the minimum spx closes off its yearly lows is 4-5%( & those are outliers). So assuming the Feb low holds , I'm reckoning on 2650+ by the year end .
My best guess is 2693 by 28/12....
cheers Krasi
This is exactly what I expect to happen.
DeleteNow it seems that the red scenario in the first chart is running?
ReplyDeleteThe most EW guys are sure third wave is running... so simple. Looking at different shares and indexes and market breadth I think this is wave a from the second leg lower. Expecting a short term bottom soon probably one more lower low and wave b taking more than 2-3 days. If it is really iii of 3 it should just make a pause max 1-2 days max and continue plunging lower to 2300. I doubt this is the case.
ReplyDeleteHello Krasi! What would be the size of wave b you are talking about, assuming we bottom around 2500? Where do you see the bottom of this second leg lower if your preferred scenario happens\? Thx a lot and good luck
ReplyDeleteI think 38%-50% of this wave a from early December if I am right.
Deletehi Krasi
ReplyDeletedo you think the downward move is done or almost, to consider long positions? tx, CL
Only short term. Tomorrow should be the low of wave 3 of C. Some sideway move during the holidays for w4 and final low in January. No need to rush with longs.
DeleteWhat is your target for 3 and 5 of C? Thanks
Delete2460-2470 for 3 and 2400-2410 for 5.
DeleteThanks Krasi for the quick response Krasi. Personally, I don't see anything stopping it from getting to 2400-2410 this week...but we'll see. Best of luck and thanks for the updates, much appreciated!
Deletewhere did the C wave start?
ReplyDeleteDecember, the move looks more like impulse so C instead of Y.
Delete3 december or 7 december?
ReplyDeleteBelow SPX and RUT(IWM) charts.
ReplyDeleteOne more low as expected and more likely wave 4 not b during the holidays. Currently the pattern looks like wave 3 of C. Another low today will finish impulse from the high yesterday which should be v of 3.
Today's lower low will hit my target from the daily chart above Y=W, but this is too fast and the pattern looks like impulse. The more likely scenario is bounce for a week or so and final fifth wave of an impulse for wave C not Y.
https://imgur.com/a/XXqjmxU
https://imgur.com/a/1ZtPM7P
Crazy week - could make the case for more volatility in low volume next week or for a rally on book squaring .Would find it hard to believe the 2504 print today was it for the wave 4 or maybe we see a triangle and just chop around next week . That would annoy the most participants!
ReplyDeleteGood luck Krasi
Obviously the impulse is bigger and this was wave iv of 3 most likely v of 3 is running now.
DeleteSo wave 4 next week will fit with your expectations.
Hi Krasi.. just wondering if this C wave is 1.618 * A from February then this fall should be over..could it be longer? if yes and if you think that this is 3 and not 5 then the fall may bring the index to almost 2200 if we assume that 5=1. That would mean bear market for all indexes... nasdaq has already touched it today.
ReplyDeleteThis labeling 20% is bear market is bullshit forget it, just watch the charts.
DeleteFrom December high wave 4 to 2500 and 5 to 2300 this is what I see at the moment.
I was wondering the same if the pattern is much bigger from January 2018 one big wave 4 from 2009.... because the indicators and market breadth behave like we are at very important low with extreme readings comparable only with 2008, 2011 and 2015.