Short term - I think we have impulse lower and the high should be tested with zig-zag. Then we should see some kind of down/up/down sequence for 20 week cycle low.
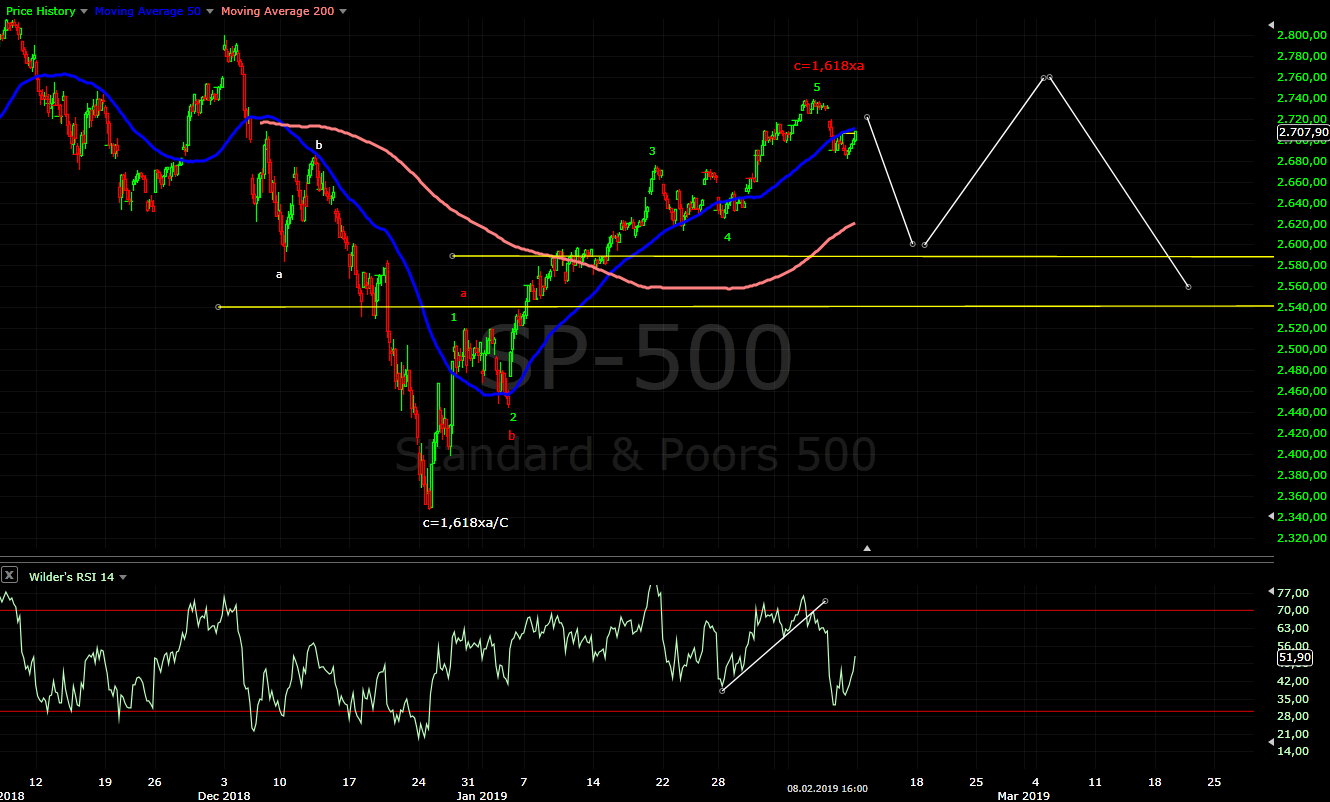
Intermediate term - MA200 hit and reversal, the histogram with divergence and RSI broke the trend line. Another rally higher looks unlikely. Probably the first leg lower will retrace 38% down to MA50 around 2600.

Long term - wave B running for IV from 2009. I am not sure if it is finished or there is one more leg higher.

MARKET BREADTH INDICATORS
Market Breadth Indicators - turned lower, but still buy signals and oscillators like A/D line and the McClellan Oscillator with divergences so we should see something lower, but short living.
McClellan Oscillator - double divergence and now close to the zero line.
McClellan Summation Index - buy signal.
Weekly Stochastic of the Summation Index - buy signal, but in overbought territory.
Bullish Percentage - buy signal.
Percent of Stocks above MA50 - overbought level and turned lower.
Fear Indicator VIX - should move higher for a while.
Advance-Decline Issues - turned lower after divergence.
HURST CYCLES
Day 31, we should see the indexes moving lower roughly week and a half-two weeks for 40 day cycle low.

Week 7 for the 20 week cycle. Shorter 18 month cycles possible with 4 year cycle low this year, so we will keep an eye how fast the pattern develops.

Boeing - one of the strongest shares. Despite that very likely corrective pattern like many other shares. Look at RSI - ziga-zag lower and zig-zag higher. Crazy pattern nested expanded flat(wave B) in expanded flat A-B-C, but waves and Fibo measurements so far are showing text book expanded flat. What I am saying do not underestimate the probability that B is over.

Thanks krasi! Is it possible a expandíng triangle for wave iv and now we are in wave D for a new all time high in 2019? I see C=161,8A and D zigzag with an objetive 161,8 of B. Thanks!!
ReplyDeleteWatching charts for 11 years and I do not remember seeing expanded triangle....
Deleteperfect thanks!!
DeleteBut if the wave B is finished, the wave C would finish too soon according to the hurst cycles.
ReplyDeleteI think we have started a cycle of 9 months in December 2018. This cycle would increase until summer, which would be compatible with c/B
Or as I have explained shorter cycles are possible and 4 year cycle low in May/June.
DeletePattern is a pattern who can guarantee that December was 40 week cycle low?
But then the wave C should be very fast because the wave B can not be the shortest in a flat wave.
DeleteThe wave C should finish in March
What flat wit shortest B wave!?!? There is no flat if we see finished B now.
DeleteKrasi, what do you think about crude and eur/usd?
ReplyDeleteCrude the same like the indexes now a-b-c higher,one more sell off and higher again.
DeleteEUR/USD lower in the next few months and then higher about a year.
Hello krasi! What if the sp500 makes a new high this week, does that invalidate the sell of thesis, and off we go to 2800 in short order? What are your thoughts? Thx!!!
ReplyDeleteWith very high probability c/B is already running. This explains why I see so many shares with mature B wave.... I wrote about this the weekend.
DeleteI can not say if we will see another 50 points or not. I do not have high probability count.
Target for c/B is still 2900?
ReplyDeleteOnly if we have 1/c/B... some are counting it this way, but when I look at the indicators and market breadth I doubt it will play out this way.
DeleteWhat way do you see it play out from here given the high probability that c/B is underway?
ReplyDeleteNot sure at the moment... as I wrote waiting for the next move for move information.
DeleteIt looks like top to me... despite the new high we have just more divergences nothing else.
It seems the top will take place today or tomorrow around 2760 SPX and US-China talks will be the trigger. Currently in wave 4 of V from 8th February
ReplyDeleteFrom 8th February maybe, but from December it is very questionable. It is more likely corrective structure.
DeleteWe are probably finishing impulse from December low. Wave 1 from 24 to 28 December, wave 2 to 03.01, wave 3 to 18.01, wave 4 to 23.01 and now the last wave. I'm living in one of the emerging markets country and my domestic index is already rolling over as less liquid. US will follow suit.
DeleteThis looks more like a-b-c/B and not like impulse. The weakest wave is iii/3, which should be the strongest.
DeleteThe only reasonable impulse which I can count is if wave 1 was finished on the first day 25.12 and wave 3 on 05.02 with Fibo extension 2,618.
https://www.tradingview.com/x/qC318Pn4/ secondo me non ce altra spiegazione a questo impulso estensivo da dicembre https://www.money.it/local/cache-vignettes/L317xH194/correction-plat-75cdc.gif?1525423749
ReplyDeleteThis is a possibility... what bothers me this wave a/B is getting way too stretched.
DeleteNot impossible, but than c/B should be weak.
si, stanno spiazzando tutti , addirittura per caldaro questa potrebbe essere la 1 di 3 quindi da una probabilita del 80% che dopo un test sui 2550 si va' su nuovi massimi
Delete
DeleteNon penso che lasceremo abbassarli 2600
Caldaro can not count waves, I do not know why the guy is "famous".... has not spotted a single correction always bullish with wrong impulses to the moon.
Deletenon so' non usa elliott , ma qualcosa di simile , ha un modo di conteggio tutto suo non riesco a capirlo ne anche io , conta onde su onde, ma una cosa intellingente che fa' nei cambi di direzione tiene conte delle divergenze su rsi
DeleteLa correzione piatta
ReplyDeleteIl vertice di onda B è quasi allo stesso livello come l’inizio dell’onda A.
For those who think we are in impulse, take a look at the corrective structure in 1937, after that the bottom fell out of the market
ReplyDeletehttp://farm4.static.flickr.com/3626/3323605898_257711d2e7_o.png
Obviously not saying this will repeat
Regards,
Mily
hai ragione ,tutto puo essere il contrario di tutto ,
DeleteIt looks like impulse, but something stinks... I use RSI to confirm counts and it says NO this is NOT an impulse.
DeleteWhats strikes on this image is that 1 looks corrective (overlapping waves etc) and 2 looks like an impulse where it is actually vertical corrective ABC, similar to what we have now. Not saying this will play out the same, especially that CBs intervene at every inflection point since 2009 and I guess next big selloff will end up in rate cut (I wonder what the market reaction is going to be)
DeleteRegards,
Mily
How do you use RSI to count impulse?
ReplyDeleteThanks
This is 1/UVXY where you can clearly see ABC with rsi confirming impulse in A and C. The RSI trendlines clearly show when each leg has finished
Deletehttps://www.tradingview.com/x/VFrDkV11/
Regards,
Mily
RSI pattern and trend lines help to find the single waves. It is very helpful if you have shallow corrective waves b or 4 - on the price chart they are not well visible, but RSI shows them very clear. This way you can find the single waves which build a complete leg up or down.
DeleteIn the case of an impulse the usual behavior is overbought/oversold level->broken trend line-> retest with divergences. If we have very strong impulse iii/3 is the first overbought/oversold level and RSI oscillates between 50-70 for a while.
If you use EW start watching RSI and with the time you will get the idea. It will help you make a decision which count is more likely and if it is right at all.
https://www.zerohedge.com/news/2019-02-13/heres-who-was-buying-stocks-everyone-else-was-selling
ReplyDeletehttps://www.zerohedge.com/news/2019-02-13/recession-alert-treasury-receipts-turn-negative-first-time-trump-election
Deletese funziona come dovrebbe essere,potrebbe essere finita qui
ReplyDeletehttps://www.tradingview.com/x/zkHTMkVs/
Caldaro passes away today
ReplyDeleteI do not follow him, but this is sad to hear.....
Deletemi sembra che era malato da un po di tempo, sono molto dispiaciuto
DeletePassed
ReplyDeleteKrasi, I'm confused, are you saying cover shorts/buy the dip?
ReplyDeleteNot an impulse is the opposite:) This does not mean go and short... just the odds that we are close to the top of the whole B wave are now higher.
DeleteYour post on December 22nd...the long term chart. How about we follow that playbook?
ReplyDeleteThat is what I am starting to think - we have the whole B wave. This weekend I explained why this is possible. With the higher high this week the odds are just increasing.
DeleteAs I wrote what bothers me is we have very strong market breadth and reversal and plunge is unlikely.
I think the odds are that we grind or rip higher...put another way, the stops lower in December are empty gaps higher in January, February and beyond - doesn't that make sense? there is no one else left to sell but the burnt out shorts who've been covering and reshorting on the way up...this is the easiest money to be made on the long side! and I'd like you to say fuck it, I'm covering my shorts and I'm not going to say anything until I've absorbed this shitty outcome over the next few days and I'm going to make an unbiased assessment this weekend. I think that's how anyone who's been short, gets smart... personally.
ReplyDeleteGo back one year and see how many times we have the same herd thinking:
DeleteJanuary 2018 no one will sell DJ 30K - yeah sure.
September 2018 SPX at least 3200/DJ 30K, it is so strong - yeah sure.
December 2018 the bull market is over it will never go up - yeah sure.
The fact that we have parabolic move means the correction is not over. The same bullshit over and over, for 8 weeks from "the world is over" to "just buy it" - I call this herd mentality.
The only question is - is this a/B or the whole B. This is what I am trying to find out and not if will go down or not.
secondo me , vista la questione tassi raffredata e' una fed accomodante sono piu propenso per un a / B
Deletehttps://www.tradingview.com/x/tf3sqTzH/ LO vedo di piu' come un testa spalle rovessciato e tutto il movimento come una correzzione piatta https://www.tradingview.com/x/tf3sqTzH/
Deleteabbiamo anche divergenza inversa su rsi DAYLI che significa continuazione del ribasso , ha ragione krasi si deve scendere e questa puo essere B COMPLETA
ReplyDeletehttps://www.tradingview.com/x/QT4OuTFO/
Sono d'accordo che sta arrivando una goccia
DeleteThis is what I see at the moment - https://imgur.com/a/frC5hxF
ReplyDeleteNDX because the pattern is better visible.
As I wrote RSI does not confirm one leg higher as impulse. We have two legs and this counts best for me. After the correction late January the waves higher look like zig-zags and it is confirmed from RSI.
I went trough all the 30 DJIA shares and I do not see a single one with an impulse zig-zags every where.
On which basis , increased likelihood that Sep 18 was a major top?
ReplyDeleteI do not think it is a major top. We saw only zig-zag lower which confirms it.
DeleteFor current wave, why IWM is much stronger than QQQ? small cap is visibly stronger? Does it mean more upside potential in short term?
DeleteNo idea. You are thinking too complicated looking for some short term correlations.... just choose one index and follow the pattern.
DeleteEnjoy reading your commentary, but it's really amazing how you've been completely wrong these past couple months. Hope you can get it right soon...
ReplyDeleteWrong for couple of months!?!?
DeleteWrong in September explaining that 3200 even 3000 is fantasy.
Wrong explaining that this is only correction and not the end of the world.
Wrong about multi month retracement higher.
What were all the experts with paid subscriptions predicting? I know what - garbage:)
Yes, the speed surprised me and could not identify the b wave exactly, but I do not see the "experts" predict it either. After the fact are everybody so smart....
100% agree!
ReplyDeleteThis is happening for the third time for roughly a year and each time close to the top:)
ReplyDeleteAll this "experts" are great contrarian indicator.
this market looks like 30,000 coming year end
ReplyDelete