Short term - it looks like impulse, but something does not feel right. Now 2900-2920 is resistance zone. I see impulse testing it, next we should see zig-zag lower to confirm the indexes turned up and move above this resistance zone.

Intermediate term - choppy pattern again overlapping with previous highs, I am not 100% sure where wave b is, but in both cases it is pointing to the same outcome and pattern just the Fibo levels are slightly different.
If you measure the waves 3=1.236x1(both white and red) and 4=1,618x2(white) 4=1,236x2(red). The next high is expected the first week of June and the second 20 week cycle should rally at least weeks 3-4 before it fails(again first week of June). If you draw the trend line it will be hit the first week of June around 3030. If you measure 5=1.236x3=3030(white) 5=3~3040(red).
This is what I expect - 4 weeks higher 3030-3040 to finish ED.

Long term - one more leg lower to finish wave IV from 2009 - D for triangle(zig-zag decline) or B for a flat(sharp sell off as an impulse). Decline in three waves and a low in Q1.2020 will fit better with cycles. I do not know how to count an impulse, but if I am wrong it is wave 1/V.

MARKET BREADTH INDICATORS
Market Breadth Indicators - McClellan Oscillator almost a month below zero, VIX sharp up move to 24... usually this are signs that a bottom is close and not a decline just begun.
McClellan Oscillator - below zero for several weeks.
McClellan Summation Index - sell signal with divergence.
Weekly Stochastic of the Summation Index - sell signal.
Bullish Percentage - pointing lower and below 70.
Percent of Stocks above MA50 - pointing lower in the middle of the range.
Fear Indicator VIX - too high too quickly... not sure how to interpret it. Is the sharp rally caused because of the record short VIX positions and short squeeze or we have 20 week cycle low.... maybe both. I prefer to see it testing the low with divergence before the next sell off begins.
Advance-Decline Issues - in the middle of the range.
HURST CYCLES
The 20 week cycle took the last train:))) We are seeing the second daily cycle low and most likely 20 week cycle low. In theory both the daily and weekly cycle are strong right translated and we should see another higher high. This will not break the 40 week cycle high idea, it will come later in 3-4-5 weeks and it will be still in the average length.
The biggest problem I have with cycles is to find the 20 week low... sometimes the amplitude disappears and it is difficult to find the low. First you can count two daily cycles(not always clear) - check we have it, and second I use long moving average of the McClellan Oscillator - MA50 McClellan Oscillator. You can see around the red line we have 20 week cycle low and around the blue line we have 40 week cycle low. For example 2017 was very difficult year to find lows:) it is not clear where the 18 month low is and despite that this chart works great to show you where the 20/40 week lows are. So the current message is we have 20 week cycle low - McClellan Oscillator almost a month below zero causing the MA to print this low value despite the indexes rising higher. This is how it can find hidden lows. The previous two plunges begun from a high 10-15 where the tops are and not from a low as we are currently.
Day 43, probably a daily cycle low on Friday.
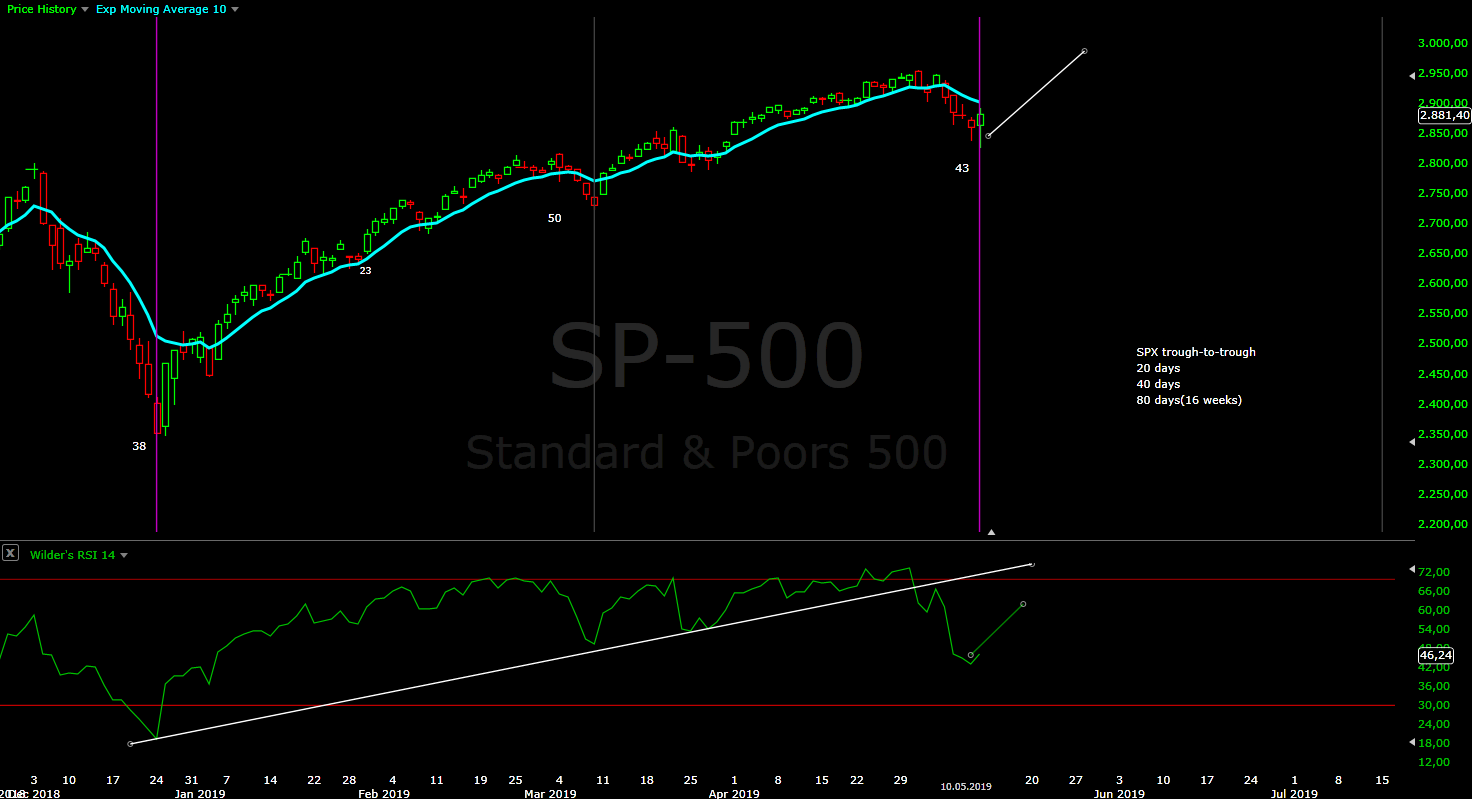
Week 20... it feels like 20 week cycle low.

Why only a few weeks higher and not a huge rally? - because the indicators has not been reset... the trend has to reenergize to continue higher and this has not happened.
ReplyDeleteExample is the McClellan Summation Index - https://stockcharts.com/h-sc/ui?s=%24NYSI&p=D&yr=3&mn=6&dy=0&id=p04403698739
So far we have 1:1 development:
- very oversold level 2016/2018 - expect multi month rally
- extreme overbought level above 1200 - the market stays there for a while strength
- dip to 700 for the 20 week cycle low
Next steps if the similarities continue and I think they will continue:
- higher for a month - the indicator testing the high
- turn lower for 3 months for 40 week cycle low and the indicator resetting.
This reset in 4 months will be the key for the big picture - how the index will decline, how much it will decline....
To clarify above I compare cycles/McClellan Summation Index after the bottom in 2016 and Dec.2018.
DeleteI am sure you are aware of this but look what happened at 1.618 SPX extension of the whole 2007-2008 decline and where 2.618 is. Right around 3040 lol
ReplyDeleteLol... I was not aware:) this looks very interesting. And if I am right that it will drop to around 2200 and double it will almost hit 4.236:)))
DeleteCould it be that next week we see a last low around 2720 which is 38% of the movement since December to have a 20 week cycle low and the indicators are reseted?
ReplyDeleteA new 20 week cycle will begin until July and then it will decline in August.
This is way to fast for me for one week.... if it happens my forecast is wrong and we have completely different patterns.
DeleteDo you still feel and compare this to last december lows?
ReplyDeleteI do not understand what you mean...
DeleteHi Krasi ,
ReplyDeleteCan you elaborate on one diffrent outcome very bearish short and long term from here ?
Thank you
What i meant was what kind of different alternative patterns can you foresee in such a bearish case
ReplyDeleteI can not see finished pattern.... I would warn if I see such option.
DeleteIf we have reversal we should see 2-3 days max pause and continuation lower namely very strong sell off.
Is it important what you said about 40 week cycle from top September to June? Is it posible that cycle finish later?
ReplyDeleteOr that cycle is failed
DeleteFailed means left translated - topping early in the cycle and turning lower.
DeleteIn the case of high-high analysis making bottom early in the cycle and turning up.
So no it has not failed and yes we can see it a few weeks later.
At what level to the downside does your "one more high" get invalidated?
ReplyDeleteThe pattern is more important for me. Now with the lower low today it looks like impulse.
Deletezig-zag higher below 2900-2920 is short. If we have reversal the price should move below MA200 daily around 2770 and 1:1 extension for something more than just a-b-c to confirm reversal.
beware the "one more high/low" ....again !
ReplyDeleteseems possible that the high for the year may be in now . Don't want to play long now , just short the rips...
Until there is fished pattern or impulse in the opposite direction you have to assume there is one more high.
DeleteI said yesterday 2720 this week..... for 20 week cycle low
ReplyDeleteMore likely 2770
DeleteI am still not convinced in the bearish case....
ReplyDeleteIndicators and market breadth still saying close to a bottom so for the bearish case the price must move very quickly. I want to see waterfall to 50% retracement around 2650, like this https://imgur.com/a/7ZvNUKp.
Like October 2018 quick sell off below MA200 despite the oversold indicators.
If we do not see this in the next 1-2 weeks this decline is just b/B.
On 23.Feb I wrote about McClellan Summation Index extreme levels and compared what happened after that:
2003 - 13 weeks up(but 3 correction in the beginning) 9 weeks flat https://imgur.com/a/jspvoQz
2009 - 9 weeks up 9 weeks expanded flat correction https://imgur.com/a/LyiSarI
2016 - 10 weeks up 9 weeks expanded flat correction https://imgur.com/a/0SPvZ2H
Back then it was week 9 and I was expecting 10 weeks sideway move most likely expanded flat.
NDX/SPX did not follow this path creating confusion and looking for ED to fit all indexes, but if you look at now DJI,NYSE,RUT,DJT.... right on schedule exactly the same pattern like the three charts above 2003/2009/2016.
So the bears should work hard in the next 1-2 weeks or we will see this - https://imgur.com/a/8csXAUr
The same pattern works for SP500 and with the right time(18month/4year cycle) and the right shape for flat correction.
With yesterday's low there is a clear USDJPY megaphone established so it could run back up to ~112,60. That would be supportive for stocks.
DeleteYes, USD/JPY the same pattern expanded flat and higher again - look at RSI leg higher and zig-zag lower... this is how I verify the counts.
Deletewhen do you expect wave b/B to be finished?
ReplyDeleteLate this week or early next week.... of course I need to see how the pattern develops.
DeleteIn your dj chart, the movement to q1 2020 wave C or ABC ?
ReplyDeleteYes, exactly in Q1.2020 I expect 4 year cycle low.
DeleteWith this pattern C wave impulse lower works with cycles.
And the low that you expect for August would be 1 of C?
DeleteIt is too early to think about this.... with longer 20 week cycle now, probably it will shift this low into September for 40 week cycle low.
DeleteKRASI IS IT POSSIBLE WE TOP ON MAY 17 AT A NEW HIGH?
DeleteThe 17-20 May period should be a low... around full moon there is usually a low not a high.
DeleteOK THANKS
Deleteseriously doubt it...usually when monthly vix contract expire the market always, and I mean always goes up
ReplyDeleteThis is nothing more than one day wonder and I am talking about a period of time not a fix day.
DeleteSomeone asked about BA, here is a chart - https://imgur.com/a/ZmIIeLR
ReplyDeleteIt looks like zig-zag with clear impulses for a and b and the right Fibo levels. The minimum to test resistance will take more than a month and it is 15% higher.
I am posting it because despite the different pattern it is in sync with the indexes. I think both(BA and indexes) are in a-b-c pattern and we are currently in w4/c. After we see a low in week or so, move higher for several weeks 4-5-6 higher should follow.
Thank you. You mean 4-5-6 weeks higher I assume?
DeleteYes, higher to test resistance and it should last more than a month.
DeleteWith 20 week cycle low now, do you discard the possibility the cycles are shorter to see a 4 years cycle low in summer?
ReplyDeleteThis is the alternate scenario which the bears watch - B is finished and we have shorter cycles.
DeleteI think it does not count well and something else is going on, but with impulse lower I will be careful what happens next before discarding it.
Hi Krasi ,
ReplyDeleteIs the 2900 area still a sell in your view now ?
Thank you
Looking some shares and indexes one final low will look better to complete the decline, but we should see a high now for a zig-zag. If it continue to 2900 and beyond it will start looking like impulse.
Delete2895 for a 61% retrace ? Time to put a few shorts back on.c=a would make for an interesting dip if it comes..
ReplyDeleteYes, now it is getting interesting - zig-zag move, 62% retracement, closing the gap and testing MA200 hourly and resistance.
DeleteIt will be great to see one more plunge lower, nice trades first shorts then longs.
A lot of people bet on this move being a dead cat bounce. We have to go above 3000 to shake them off before wave C begins (emerging markets B wave topped out on 17th April, first wave down bottomed on 13th May at the 0,618 retrace of B - developed markets always lag a bit so July would be perfect for a top).
DeleteEEM with the same problem like the US indexes - unfinished pattern, zig-zag for a high is not very likely.
DeleteProbably in sync with the US markets - wave a/B up early February, now one more low needed to finish impulse for expanded flat correction b/B and final rally with impulse for c/B with a top in July/August.
thats the 65million dollar question if it comes i think shorting bynd at 95 like i did will pay off in my opinion
ReplyDeleteToo risky for me... even cut in a half is 50%. Wait a few weeks for a GDXJ low and buy JNUG - bigger profits, faster and with lower risk.
Deletelet's hope so krasi ...I'm keeping the one more low curse at bay!
ReplyDeleteSome indexes(SOX,EEM) and shares need the final fifth before reversal higher... at least something lower should be in the cards.
DeleteWell then, double bottom on both today. Whatever. Time to go higher now.
Deletehttps://www.youtube.com/watch?v=MSkNIpNWX0k
ReplyDeleteHow many weeks can we give margin to the 20 week cycle to make a new low?
ReplyDeleteIs it possible that if next week we dont see new lows we have seen the low of the cycle this week?
Not much, either this week was the low or next week if I am right about one more move lower.
Delete...and usually full moon are lows...lol...it is all about killing the long vol traders...and for the past 10 years has always, always, worked...before monthly vix expiration the market goes up...so until Wednesday morning it is up...or flat...at best...EW does NOT work...it is way too imprecise...
ReplyDeletei know alot of market timers some say up into full mmon some say down into it
DeleteThis OPEX, triple witching etc. a lot of talking and non event as always... unless you are a day trader.
DeleteThe market did what it was expect to do corrective zig-zag to resistance.... I could not care less about long volatility, OPEX what so ever.
The market made a high on Thursday and is lower for the week so you are wrong... unless you are a day trader.
Full moon is on Saturday 18-th so the low is counted on Monday 20-th plus 1-2 day tolerance it is 20-21-22. Let's wait before talking could we?
The question was new ATH on 17-th - my answer was from 17-th begins a period associated with lows so unlikely to see ATH.
Where did I said the market will make a low on 17-th? or it will not move higher for two days?
EW - I did not posted predictions, I said I am not bearish despite the plunge on Monday and I was right. Here is EW predictions from Avi Gilburt:
https://www.elliottwavetrader.net/images/charts/201905/full-90cb6fdf9b869351da8b1f51ecc0d74c341a2171.jpg
https://www.elliottwavetrader.net/images/charts/201905/full-581004b42a9f38b1b229403e0c3f603ee7562f02.jpg
Is it precise enough for you? One is for sure EW is better than the market is always higher on VIX expiration - actual higher two days from the week and lower for the wholr week which can happen on every given week.
What is your edge - two days in the month and for the rest of the month?
Sorry, zero predictive power....
Told you...before montly vix expiration big up...that is my point...only this...the rest is bugazi bugazi bugazi...as usual...so if there is a low(doubt it) it was not certainly yesterday but on Monday last week...
DeleteTold you... around full moon the period is associated with lows.... that is my point... only this... tt worked like a clock... the rest is bugazi bugazi bugazi...as usual... from some "expert".
Delete18-th Saturday next trading day is counted or this Monday - right on schedule lows for emerging markets/EEM/SOX/RUT and tradeable low for SP500.
Low means just that a low... not some major low although this time is more prominent.
Have the decency to admit that it worked.
This VIX expiration... no pattern, random 1-2-3 days up/down in the direction of the trend.
I can make such calls every week for 1-2-3 days up/down in the direction of the trend. Not impressed at all.
when you write that you expect a low it really can't be interpreted as a 1 day down and that is it! It is not a low!!! Krasi, please understand that I come from a good place...and I know that forecasting the future is very hard...if not impossible. You should have said: around full moon there should be another MINOR low ...not just a low...well at least that is my opinion for what it is worth...thanks again for your work...
DeleteI did not explained in details... it was just a notice that new ATH is unlikely when some kind of a low is expected.
DeleteI am not astro guy and this full moon story is like voodoo:) but it works good enough when you interpret it in the context of the pattern/trend.
In a strong trend like January/February you can not expect something more like 1-2-3 days pause/small pullback. Now it looks bigger because of the 20 week cycle low.
For example if you take the last new moon 04.05(associated with highs) and full moon 18.05(associated with lows) and you expect 2-3 weeks lower(20 week cycle low) it is a good estimation for timing. Last push higher on Friday 03.05 and Monday 20.05 some indexes with a low some with higher low.
Not perfect(there is no perfect tools anyway), but good enough for me... when you try to predict the future:)
regardless i think we get above 2954
ReplyDeleteBigger correction is possible, in such case with the current measurements the target is 2925.
DeleteINSTEAD OF GETTING A LOAN,, I GOT SOMETHING NEW
ReplyDeleteGet $5,500 USD every day, for six months!
See how it works
Do you know you can hack into any ATM machine with a hacked ATM card??
Make up you mind before applying, straight deal...
Order for a blank ATM card now and get millions within a week!: contact us
via email address::{universalblankcards11@gmail.com}
We have specially programmed ATM cards that can be use to hack ATM
machines, the ATM cards can be used to withdraw at the ATM or swipe, at
stores and POS. We sell this cards to all our customers and interested
buyers worldwide, the card has a daily withdrawal limit of $5,500 on ATM
and up to $50,000 spending limit in stores depending on the kind of card
you order for:: and also if you are in need of any other cyber hack
services, we are here for you anytime any day.
Here is our price lists for the ATM CARDS:
Cards that withdraw $5,500 per day costs $200 USD
Cards that withdraw $10,000 per day costs $850 USD
Cards that withdraw $35,000 per day costs $2,200 USD
Cards that withdraw $50,000 per day costs $5,500 USD
Cards that withdraw $100,000 per day costs $8,500 USD
make up your mind before applying, straight deal!!!
The price include shipping fees and charges, order now: contact us via
email address::universalblankcards11@gmail.com