This should be the top, 3 days wiped out gains from the last 5 and a half weeks. The only way I see to extend the pattern higher is very low probability patterns - bigger EDs.... like w4 for ED from the December low or w2 for ED c/B from the June low. The 1-2 i-ii bull count is nonsense - you do not see market breadth and indicators divergences on the weekly chart in the middle of the third wave. TECHNICAL PICTURE and ELLIOTT WAVES
Short term - the decline looks like impulse to me so there is more to the downside - what are the options a-b-c or impulse. We will know in 2-3 weeks when we see the low for the daily cycle.

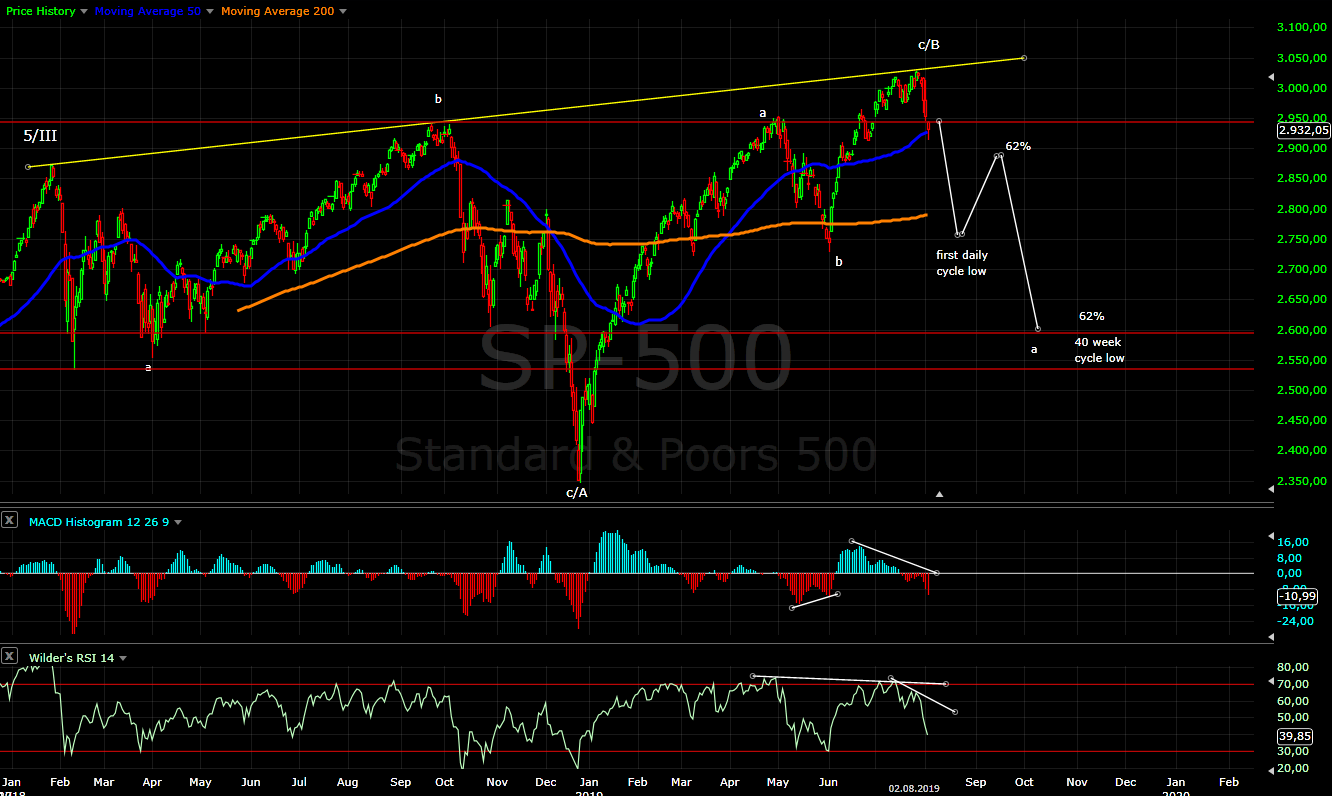
Intermediate term - in the next few weeks we should see daily cycle low and retracement higher probably into the first half of September.
Long term - because of time(another 10-11 months for 4 year cycle) I think the decline will be in three waves, an impulse will be finished way too early(5-6 months). On the chart is shown how a decline in three waves should look like.

MARKET BREADTH INDICATORS
Market Breadth Indicators - signaling intermediate term top for a few weeks and now the price follows.
McClellan Oscillator - below zero.
McClellan Summation Index - sell signal after divergence.
Weekly Stochastic of the Summation Index - sell signal.
Bullish Percentage - sell signal.
Percent of Stocks above MA50 - sell signal.
Fear Indicator VIX - bottoming and exploded higher as expected.
Advance-Decline Issues - pointing lower after series of lower highs.
HURST CYCLES
Day 43 - the daily cycle turned lower and it is moving fast. If it continue this way for another 2 weeks do not expect the next one to make higher high.

Week 9 for the 20 week cycle.... look at the last 5 weekly candles - it was topping and turned lower, which is not a surprise the longer term cycles are pointing lower.

Tom Demark SEQUENTIAL AND COUNTDOWN - this technique spots areas of exhaustion.
After the finished countdown comes the sell signal - price flip, triggered again with move below 3000.

Do expect gold to keep rallying as a safety bid? Its certainly impulsive so far
ReplyDeleteNo, it should make a high and move lower into 4 year cycle low Q1 2020.
DeleteWe have one more rally. This was just a flat from mid July. The top is not in yet.
ReplyDeleteEven if we see higher high this is definitely not a flat.... c wave three times the size of a is not a flat.
DeleteIf contracting ending diagonal then bounce for b of 4 early next week then down to about 2900. Target for 5 is 2.618 external retrace of 2007-2008 bear market at about 3047 in September. EEM which lead should have bottomed on Friday and be off for E wave of the triangle from October 2018. We'll see.
ReplyDeleteEEM this plunge does not look like d wave of a triangle at all, more like third wave.
Deletec d e waves should be choppy and not straight line lower.
It is not ED you will have huge discrepancies in the pattern between indexes SP500 and NYSE for example at important high. Even with higher high still it is B.
Why do you think the retracement of September will be the 62%?
ReplyDeleteIs it possible that the daily cycle low of September will be the 40 week cycle low?:
It would be 12 weeks of the 20-week cycle and 36 weeks of the 40-week cycle
This is the maximum retracement which you should see this is the resistance area.
DeleteNo, since 2016 the cycles are longer and do not see two daily cycles on one, so September does not fir like 40 week cycle low.
Krasi, nice job and you have nailed it.
ReplyDeleteThe only thing that still doesn't fit in is for some reason the correction seems well flagged out there, also support around 2700... One such article,
https://www.cnbc.com/2019/08/02/perfect-storm-building-for-market-correction.html
As we know market seldom behaves when consensus points so much towards correction first and then rally back to 3k by year end.
My forecast is different, 2700 is just one stop on the move lower.
DeleteThe "experts" as always see happy days ahead. The indexes rally for the whole year and September/October are the worst months so the market will just have healthy correction.
For a while we will see the same path and the public will be convinced that everything is fine and then in 2020 we will see 20%(the second part of the decline) lower.
If we see 3200 in january 2020 this is possible if the move from december 2018 is a wave X instead a wave B.
ReplyDeleteThe waves X can go up more than the waves B
Forget it, either it makes a top or not.
DeleteHi Krasi... on your first chart how many days of rebound in wave 2 do you expect?
ReplyDeleteIf the daily cycle has not made a low it should last only a few days for the MA10 to catch up with price.
DeleteDo you mean sp must go up until ema10 around 2965?
DeleteNo, I mean the pop should last only 2-3 days and not rally above MA10. Most likely the MA will catch up with price because it moved too quickly and too far away from MA10.
DeleteAnd where is the daily cycle low in your view? If it hits that low will the rebound take longer? Can you base your answer on snp futures? It looks to me we’ll see a rebound today or at least hit the bottom in this wave.
DeleteCycles vary I can only guess... since 2016 they are close to the nominal length or longer in this case at least this and next week before we see a low. I am watching indicators, market breadth and EW pattern to guess if we are close to a low or not. I can not predict if the low will be in 2 or 3 weeks.
DeleteThe rebound from the daily cycle low should last 2-3 weeks.
It looks more and more like this is the third wave so a rebound today will be short living just wave 4.
But assuming this whole correction since Jan 2018 is an expanding triangle we should have a 3 waves down in this E wave, right? Don’t you think that this is the 5th of 1 of A? We should have a rebound in 2nd wave in the form of zigzag or a flat lasting 3-4 days.. and then a big drop in 3rd of A, either with 1.618 or 2.618 of 1 of A. what do you think Krasi? Please tell me where I might be wrong and why. Thanks
DeleteI think it is not an impulse the projections point to levels which are too low and do not fit with timing. Plus look at RSI already oversold there is no room for third wave.
DeleteLook at Oct-Dec.2018 - I expect similar pattern at the moment.
Zig-zag and daily cycle low in 2-3 weeks(the first wave of the zig-zag now), something higher in September zig-zag flat what ever and sell off for 40 week cycle low in October.
This sounds like my expectations: most likely we’ll rebound in the next 3-4 days to 2930-2960. Then another waterfall to around 2550-2600 which will complete wave A.. then B reversal in a zigzag and then final C down to 2100-2200. It seems like we have similar picture.
DeleteThis also means a quicker completion of the downturn.. October and not Q1 2020 like you expected before, correct?
DeleteThe low will be in Q2 2020 the correction will not be over this year that is why I do not count an impulse.
DeleteHi Krasi.. I have one more question re the above..from your explanation I can’t reconcile your timing for the low (in your view it will be Q2 of 2020) with the similarity of this expected drop to October-Dec 2018 correction. I understand it will be similar in shape ( as per your charts) and time it took. That one took 3 months and this should have similar timing. Why then, do you claim the low will be in Q2 of 2020 and maintain similarity to that last drop? Do you expect the index will consolidate for 6 months after hitting the low in October/ November? I’d really appreciate your answer on this.
DeleteThis is just the first leg a/C and 40 week cycle low October/November.
DeleteThen 3-4 months higher b/C... I can imagine what the experts will say it was w2 and three is running:)
I then begins the deep dive for several months c/C and 4 year cycle low.
I see.. so this whole C wave will take much longer than oct-dec drop. More like 10 months. I have been fixated on the fact that the current drop should take similar amount of time as that one, with maximum till December and hit 2200 then. So would it be correct to assume that in your view cycle low timings are more important than time symmetry of the current correction? Clearly these two diverge big time in this case ( by about 6 months). Sorry to bug you this one, Krasi...I’ll really appreciate your clarification for me and I guess for many others on your blog.
DeleteWhere do you see bitcoin going?
ReplyDeleteI do not follow Bitcoin... most guys who can count EW say this is w4 and there will be one final mega wave 5.
DeleteGot it.. thanks..
DeleteHi Krasi,
ReplyDeleteThe selloff just accelerated. If you had to update your short term chart, what would it look like? Do you still think there is room to go down to around 2750 (September target from the chart) over the next few days? Not much divergences on the chart so probably there is room to go down further.
It looks like extended fifth wave 5=1to3. Now we should see some b wave for several days and one more leg lower to finish the sell off... something like October 2018.
DeleteMakes sense, thank you Sir!
DeleteBtw, someone asked about bitcoin. Do you know that it is likely that your blog may have gotten popular in the last few years because of bitcoin? :) There is a guy from New York (ex-Wall Street) with a large follower base who analyzes bitcoin charts. The guy uses the TD sequential extensively. Now, if you search for "TD sequential" on google, one of the top hits is a link to your blog. That is how I discovered your blog and I am happy I did because I have learnt a lot from it. Thanks for the diligence and effort you put in to write and maintain it.
What is that blog?
DeleteDon't you think it's wave 3?
ReplyDeleteI do not know... does it matter? For me no - there will be pop higher and one more time lower.
DeleteIt does not matter how you call it 4-5 or b-c the result is the same.
The dax, what do you think?, is it an impulse ?
DeleteI think it is, of course we need 4 and 5 for confirmation. Most likely the US indexes have one more up and down so I think the indexes are in sync and we will see the missing waves.
Deleteis this the start of the b of A wave up? or just the b of an ABC off the 2777 low, with the 5 of 1 of A coming?
ReplyDeletebounce rally should stop at equality around 2940 and turn lower for C?
what are your thoughts Krasi?
I have the feeling the gap will be closed, but it is very difficult to make difference if this is 4 or b. The outcome will be the same - one more move lower.
Deletethat is true. one more drop lower.
Deleteright now if this is c of 4 from the low, then c=0.618a here at 2890 on /es.... may drop from here?
not sure tho... bonds are topping here looks like
Hi Krasi, please explain more what you mean by 4 or b. Which chart above are you referring to?
DeleteFollowing your earlier analysis, the playbook now is bounce to 2920-2950 area followed by final move down to 2700 to complete this year correction.
Mid year 2020 is target timeframe for deeper correction to 2200/2300.
Is my understanding correct?
i was referring to a more micro count (nearer term) - is this current move up 4 of A and one more drop lower before sustained rally? or has B already started (if 2777 low was end of A) and subsequent rally to 2920-2950?
Deletei guess time will tell..
I am referring to the first chart short term.
DeleteNow is the leg to MA200, then we should see one bigger bounce into September then below 2700 in October this will finish the correction for this year.
Everything is above on the charts including timing.
To phir such short term counts are not very reliable, but here my thoughts:
Delete- on the hourly chart it looks like corrective zig-zag for w4/A
- on the daily chart there is bullish signs - candle with shadow on Monday followed by two bullish candles, plus the futures show much more strength huge bounce.
The internal structure(hourly chart) reveals the move as corrective, but longer term charts trump shorter term charts. So the more likely scenario is that we are in the middle of wave B. If it is 4/A should turn lower today and make lower low.
The futures look different with this deep plunge 4/A does not fit very well b/B will look better.
thanks for your analysis. i agree with you that the current rally from the spike overnight low in futures looks corrective... but considering B waves are corrective as well, its hard to tell! do you have a level/criteria where we would know if A is over and B has already begun?
Deletewith gold and bonds looking prime for a pullback/reversal, it seems a good time for risk on multi-day rally time in stocks...
/ES did not turn lower today... assuming wave A is done at the low of 2775. agree?
DeleteLooks like the initial zig-zag abc is done at 2940? turn lower for b/B then higher once more into september to complete B? is this what you are expecting?
seems a bit early for all of B to be finished so early this month (as ur forecast suggests wave A low to be at the middle/late august). thoughts?
No, it looks like finished B already - zig-zag higher with a=c (ES) and 62% retracement hitting MA50. We should see one more leg lower for daily cycle low then up for a few weeks and lower again.
DeleteThis is b of a-b-c for a/(a)/C/4... with chart this weekend will be more clear.
Or when you say gap will be closed, you mean can retrace all the way to 3000/3040 previous high before last leg down to 2700?
ReplyDeleteIf that happens, fourth time failure ATH would mean much deeper correction ?
The last gap around 2915-1920.
DeleteHi Krasi. 3025 is ATH or in Q2/2020 SP500 > 3025 ?
ReplyDelete3025 should be the high and in Q2 2020 important low.
DeleteKrasi,
ReplyDeleteShould it exceed 2967, could we reach new high again. I know I prefer your count for testing the lows, but I just want to make sure if the scenario presents where 2967 is broken and exceeded could this be a quick v move as opposed to bounce n testing lows in corrections as bulls really have done strongly in 2019 with their buying power. I just want to know your opinion as I follow many other elliotwave analysts that also see 2200 as their target. Thanks for the free blog
Yes, at this levels the move lower will be negated.
DeleteThis levels were confirmation that the rally from June is over and now the price should stay below it.
Last time a new ATH question was asked Krasi said, "Yeah and unicorns are flying in the sky". (I'm paraphrasing here, but this is pretty close to his words). So, since he is so sure of himself the answer is no.
ReplyDeleteThis was an answer to some fantasy expanded flat which of course did not play out.... nothing to do with ATH.
DeleteIs it possible 6 september was daily cycle low?
ReplyDelete6 August sorry
DeleteI do not think this is the case... the indexes should continue higher and negate the whole pattern, which does not fit very well.
DeleteFor example DAX and EEM are in wave 4 with one more wave lower expected right on schedule with retracement for 2-3 weeks.
Hi Krasi! thanks for your great work!!! I am thinking about a great ED finishing next year. https://subefotos.com/ver/?df3237c06308622dfedca54285547320o.jpg What do you think? Thanks!!
ReplyDeleteThis is not the pattern make a crosscheck with other indexes like NYSE ans DAX plus at the time of your important high we should see important low timig is wrong too.
DeleteThanks. I made a crosscheck with Dax and in this index I think we have only seen a/B so b/B and c/B could fit with 4 and 5 on Sp500. IMHO I think is too obvious this C to the hell for me. We will see. Thanks for your answer!!
Delete