Short term - with some creativity ignoring upper trend line and candle shadow you can draw another trend line and count w4. The move up is another zig-zag so most likely ED.
Alternate scenarios are flat or triangle, but then the creativity will not help... the correction will be too big to be part of this rally.

Intermediate term - expect two more touches of the the trend line in the next two weeks before the ED is completed. The indicators - just more divergences, one day and a half is too short to reset the indicators and erase the divergences. This is not an important low so that the indexes can re-energize and continue higher, this is topping.
I find it interesting if you count w-x-y as shown on the chart you have a cluster of three different Fibo measurements in the same area. Such a cluster shows with very high probability the target area for a move and on top of this the count and measurements work for SP500/DJI/NYSE/NDX... fascinating, isn't it:)
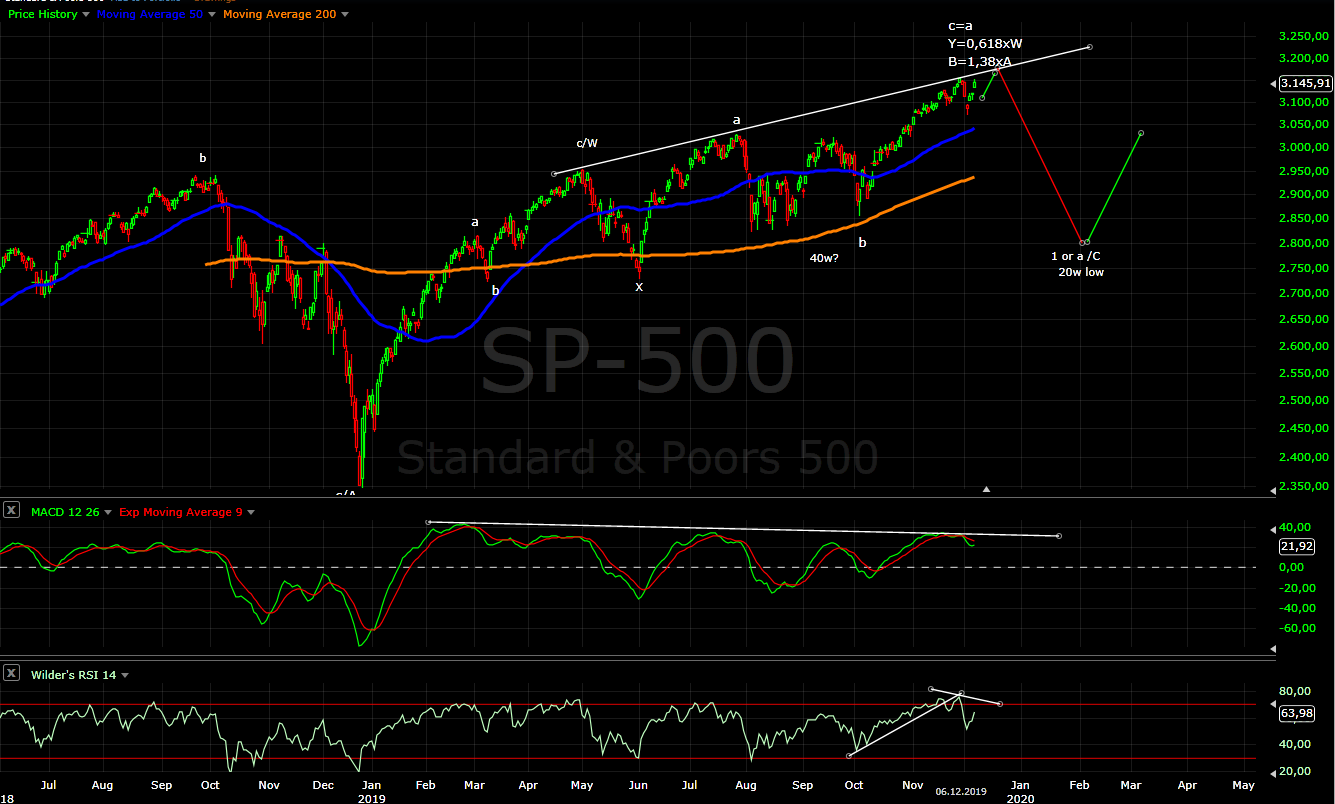
Long term - close to the top of wave B. When it is finished expect sell off to begin and to continue into Q2.2020. It will complete the correction which begun in January 2018. Alternate scenario a decline in three waves, but still a decline.

MARKET BREADTH INDICATORS
Market Breadth Indicators - very weak for a long time and going nowhere with multiple divergences.
McClellan Oscillator - above zero with multiple divergences.
McClellan Summation Index - sell signal with multiple divergences.
Weekly Stochastic of the Summation Index - sell signal.
Bullish Percentage - at the overbought level with multiple divergences.
Percent of Stocks above MA50 - at the overbought level with multiple divergences.
Fear Indicator VIX - spike higher as expected and now the low is tested, right on time for divergence and important high.
Advance-Decline Issues - in the middle of the range, preparing for another divergence.
HURST CYCLES
From now on I will focus on the cycle which I call daily cycle and stop mixing with Hurst cycles. This daily cycle is not Hurst cycle. Sometimes it corresponds to 80 day Hurst cycle sometimes not. It's focus is trading, it does not care about theory for example Hurst cycles if we have 40w low in August or October or EW what pattern we have etc. It is simple, objective and effective - above MA10 is up, below MA10 is down. The idea is for traders without experience to stay on the right side of the trade:) and to make difference between analysis and trading. I explain over and over that drawing some line up or down is not a trade and I hear all the time - missed the move, wrong all the time, lost money because of you etc.
Daily cycle trading - the price broke below the trend line and MA10, RSI broke below the trend line and MA18. We have strong right translated cycle and we should expect one more higher high and "failed"(left translated) cycle. Usually a strong move is followed by higher high and a cycle which makes a top early and reverses(left translated).
The price/RSI moved above the the trend line and MAs and it seems the next daily cycle begun. My positioning now is - waiting.

Monthly chart - the 4 year cycle consists according to the nominal Hurst model of 54 months and November was month 54. The indices are at 4 year cycle high - this is for those who think that the indices are going to accelerate north.... good luck with that.

Monthly chart TA look - bearish rising wedge, RSI broken trend line and testing it for the second time with double divergence again all this on monthly chart - the writing is on the wall.... for those who can read it.

Tom Demark SEQUENTIAL AND COUNTDOWN - this technique spots areas of exhaustion.
Weekly chart sell setup at 7, add two weeks for the ED and you have 9.... fascinating, isn't it:)

Very nice, I'm very apreciat your work, I just prefer in the mounthly chart the lin with the end
ReplyDeleteHi Krasi, thank you very much for sharing your work. Have you not considered that Sep '18 could be the 4 yer cycle high? I used to discount it as well as it's way too early, but seeing the 200dma curling up again and acting as supports makes me seriously consider this possibility now.
ReplyDeleteOr put it in another word, at what technical point would you consider the more bullish scenario? I think price is still king, and it's now suggesting something more bullish may be going on. I've been a bear for the last 1 year but I'm about to change my opinion now based on what I'm seeing.
DeleteBetween two 4 year cycle highs must be one 4 year cycle low. In this case two weeks into the October low is 4 year cycle low - I do not think this is right cycle count.
DeleteTo Unknown - when we see only 10-15% zig-zag correction for 2/V.
DeleteThose who think that after 35% for one year the indices will just continue higher live in fantasy world.
I understand that you were bearish at the low and now bullish on the top. You should work on your emotions and learn to read the charts.
Krasi, market has done it's job. If you read elliott wave trader board, the bears have thrown in the towel.
DeleteHi Krasi. I think a 20% drop in Dec '18 is already deep enough to be a 4 year cycle low, just that the timing is out. And I've not turned bullish by the way, I have turned neutral and my bias is no longer bearish for now until I see more price action. I've started to see conflicting signals here and I will respect what price is telling me. We could still have a blow-off top until Jan before the whole thing collapses, but I'll just be a spectator for now.
Delete3 of december, 10 weeks cycle low?
ReplyDeleteOnly if the pattern above plays out.
Deleteand what is the alternative ?, 20 weeks cycle low?
ReplyDeleteToo early for 20w low we will see this end of January to mid-February.
DeleteAlternate is flat correction or triangle and the 10w low comes later.
I have stopped looking for shorter than 20w cycles, because this leads only to more confusion. Instead of this switched long ago to this daily/trading cycle - I do all this for the trading not for the theory.
I dont agree with your first monthly chart. You say sp 3700 for 2023-2024 but I expect a 9 year cycle low in 2023-2024 with sp in 1500-2000
ReplyDeleteSimple from the current high the next 4 year cycle is 2023-2024 then you will see your 9 year cycle low.
DeleteYes, but I expect sp at 1500-2000 for 2024 and on your first chart you say sp at 3500 for 2024, I do not understand
DeleteWhy are you so sure that 2024 is 9 year cycle low? Because the Hurst guys count 2020 as 9 year cycle low.
DeleteYou said it in long term update in june. And in comments from a few weeks ago you said you think the usa indexes have shorter cycles of 6-7 years and the last one started in February 2016 and it will finish in 2023-2024
ReplyDeleteWhere is the problem to see the next 4 year cycle high in 2023 and the next 4 year cycle low in 2024? The cycles vary, the current one are longer. The next one will be pushed further in time.
DeleteThis discussion where is the next 4 year cycle high/low are useless. We should focus on what is currently happening. Important is trading and not the theory what will happen in 4-5 years.
ok, but if we are in wave 4 from 2009 and we expect the wave 5, the wave 5 will last 3 years and the wave A of (IV) only 1 year? there is something that does not fit
DeleteI think is more likey the wave 5 last 1 year and the wave A of (IV) 3 years as in the period 2000-2003
No clue what you are measuring. What has wave a of 4 with 5 to do???? Wave 4 is measured against wave 3. From 2009 w3 2011-2018 roughly 6 years, w4 retraces 2,5years which is roughly 38% time... price will retrace around 38% too. Classical w4 measurement I do not see the problem.
Deletethoughts on $PCG? Thanks
ReplyDeleteToo late for short, too early for longs. If you want to go long wait until the indices complete the correction next year. I do not like such rollercoaster...
DeleteOne more time the two options ED or alternate flat and one more high - https://imgur.com/a/Uc8u00f
ReplyDeleteI am starting to think that we have w4 from the August low and not from October... and this is the missing impulse for c/B. Corrective structure with zig-zags, but it is impulse.
You can see a very nice canal from may to August to October
ReplyDeleteAbout the wave 4 and 5:
ReplyDeleteI agree with you that the wave 3 was from 2011 to 2018 and the wave 4 from 2018 to q2 2020, allright.
But I expect the wave 5 from q2 2020 to q3-q4 2021 and then 3 years decline to 2024.
You expect 3 years for the wave 5 from q2 2020 to 2023, I think it's too long
With cycles hurst:
DeleteI think september 2018 was a 4 year cycle high and the next one will be in q4 2021 (wave 5) and then 3 years of decline for the 4 years cycle low in 2024.
I think this is more likely that a 9 year cycle low in 2020
February 2016 was a 4 year cycle low and the next one q2 2020.
DeleteAnd february 2016 was also a 9 year cycle low and the next one 2024
This is just a guess like mine. As I wrote above lets wait for the pattern to play out. Trying to guess what will happen in 3 years is useless.
DeleteDid you close your short?
ReplyDeleteNo, the index is roughly 20 points higher which is... 0,6-0,7%. It was 19.11 at 3125
DeleteI have a small position, this is the idea you can hold for a while, wait for the top and adding later again. At the end you can have nice average close to the top.
Now when the pattern is taking shape I can adjust the strategy. I am wondering if I should close it or not at break even when the second gap from last week is tested... or just add another 1/3 around the top.
ok thanks
ReplyDeletekrasi what is target on uvxy and tvix? thanks
ReplyDeleteI assume the same pattern for SVXY like the indexes then the calculation for uvxy is between 13,50-14 TVIX 59-59,50.
DeleteIt seems the ED is getting confirmed - too many choppy moves and not one more sell off as SC expects. We will know tomorrow after FOMC.
So you close the short?
ReplyDeleteToday before FOMC... with ED and triangle you need at least three waves to be sure, but so far it seems the ED is on track and we should see c/2.
Deleteany thoughts on $OMI (owens & minor) and $TUP (tupperware)
ReplyDeleteBoth have declined drastically..
Maybe there is a reason why they have declined. I would not look for a bargain when the indexes should plunge 30%.
DeleteOMI has at least one more sell off. TUP is awful in wave 3 so oversold bounce for w4 and continues lower.
Krasi,I enjoy looking at your work and wishing you all the best.Kindly keep doing what you are doing with the cycles work and we all have to understand you have nothing to do with any of us.You do not have a crystal ball and forecasting the future.Anybody that deal with the markets must be prepared to doing their own homework.Please disregard any negativity with people and go forward.
ReplyDeleteThanks!!
DeleteOf course that I make mistakes. In the last three years I have learned from my mistakes and now I can read much better market breadth,EW,cycles. I think in the next years I will make better forecast not only for the big picture, but for the path of this moves too.
On the other hand first we deal with corrective waves in the last two years and second this is just a free blog without any obligations so this accusation how wrong I am or I mislead some one are somewhat too much.
Most of it is emotions - some made great profits and are now emotionally attached to the trade(dopamine:) They do not want to hear a bad news. I am destroying their happiness:)
You are always welcome!Happy Holiday and a Happy New Properous New Year!
DeleteAny thoughts on PG?
ReplyDeleteTopping like the indexes.
DeleteAgreed, thanks for your insights as always.
DeleteNew ATH, ED in play
ReplyDeleteED still looks like the best option... too shallow w2, but I can not see a pattern fitting better.
Deletewave 2 of ED can be very fast, I think you are right, I have the same count. From october abc with c in ED and c=a, now wave 4 o may be 3 still
DeleteHi Krasi, as a novice, I have a question related to dealing with emotions. I am learning and getting there but your advice is always valuable so I thought I will ask anyways. On days like these, I sometimes feel stupid to have gotten out of some of the positions from stocks. You sell something (for risk/money management reasons), then it goes up 10-15% and the feeling sometimes sucks. :-) How to effectively deal with such emotions? :-) I read "trading in the zone" and it was a great read but your insights are always very useful.
ReplyDeleteI can not explain something smarter than the book:) But I will say a few things....
DeleteNo matter what you do, you can not predict the future, you can not squeeze the maximum from a move, you will make mistakes/loses. You have to accept this - you can not change it, this is part of the game.
Focus your energy on what you can change, what can you do better next time:
- You can change your perspective - shit happens no one can predict the future move on to find the next setup.(Deprive the energy from the negative emotions)
- You can change your thinking - the glass is half full not half empty, I have made 5% profit I do not care that I missed 5%. Next time I will do better (create memories with positive energy)
- You can change how you act - did I followed my trading system, did I had the discipline. If not why? How can I overcome my inner voice which makes me do stupid things.
You have to "rewire" you brain and it takes years in many small steps to change your way of thinking/reacting. It is a long path which everyone walks alone. No one can do it for you.
Depriving energy from negative emotions and diverting it to finding the next setup is the key. Thank you very much, as always!
DeleteWhat does ED mean? Sorry for the dumb question.
ReplyDeleteEnding diagonal aka bearish rising wedge.
Deleteit's that one last high moment ....3180 tomorrow ...or do they just pull the rug and trap the ED players....??
ReplyDeleteI think it should be finished... usually when you trade a triangle or ED - you do not wait until the last moment position should be initiated with wave c(triangle) and wave 3(ED). Wave e could be short and suddenly reverse and for ED it is difficult to hit exactly the high... most of the time are nos so perfect.
DeleteAll this could be done again with 1/3 or 1/2 of the position and wait for confirmation.
Krasi look DJI, it is more evident, wave2 62% of 1, wave 3 62% de 1, now wave 4 already
ReplyDeleteYes, DJ looks better because it is weaker... time is ok w1 was 3,5 days and I was expecting 2,5 days for w2, but w3 is very quick:)
DeleteHow do you follow an ED? with the rsi? how should it look like?
DeleteED is three zig-zags higher with overlapping. Usually RSI has similar shape like the pattern... you can count the same waves.
DeleteThere is now possible finished ED... or it is w3 it is difficult to say
ReplyDeleteI think w3, it is 62% of w1. w4 2-3 days and w5 too. Friday 20 is futures expiration
ReplyDeleteYou are right it will look better with one more high. This is my initial idea 2-3 days per wave and the end of next week it is complete.
Deletehttps://imgur.com/a/cYZo3Kv
ReplyDeleteForget about rally, the indexes are making important high and will decline 30%.
DeleteYeah but how High is the market going to go before it drops 30% 3400 what's the Hi
DeleteAnother 20-25 points higher just below 3200.
DeleteThen down 30 percent no way
DeleteJust wait and watch:) the pattern is clear, it can be see everywhere most of the indexes and many shares.
DeleteBy this month
DeleteNo, for six months
DeleteI'm a glutton for punishment but I still made Money I am long UV XY 14
ReplyDeleteciao KRASI ,COSA NE PENSI? https://www.tradingview.com/x/zBOeTADw/
ReplyDeleteNot an EW pattern and I am not big believer in this expanding patterns. They look great in the books and rarely to be seen playing out.
Delete