Short term - wave iii for the ED. Confirmation for reversal is a move below 3130 - support and the trend line. MACD and RSI with divergences - this is a top.

Intermediate term - the trend line touched one more time. MACD and RSI with divergences. According to my EW count the index is completing impulse from the October low and most likely this is c/B... or c/y/B it does not matter much.

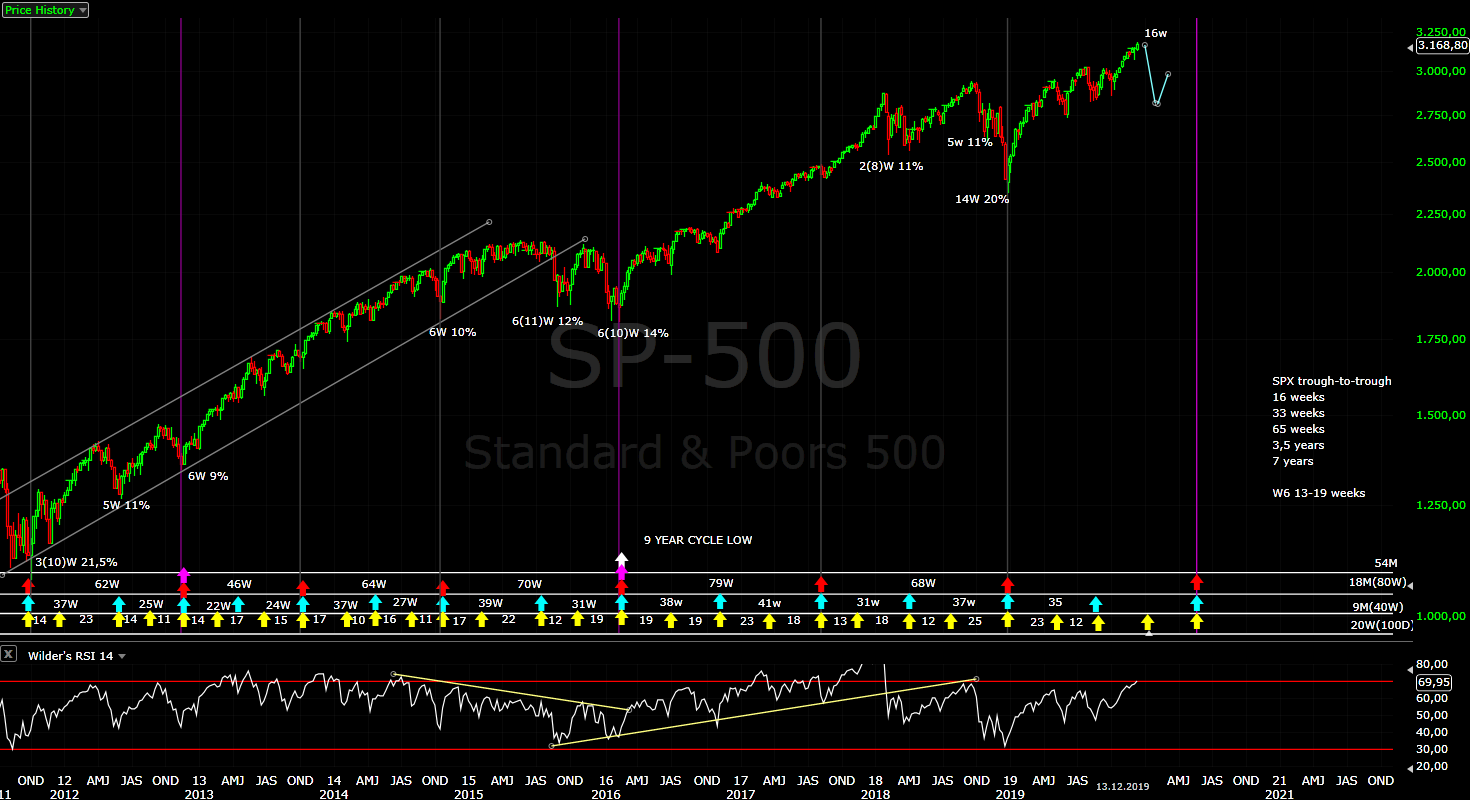
Long term - close to the top of wave B. When it is finished expect sell off to begin and to continue into Q2.2020. It will complete the correction which begun in January 2018. Alternate scenario a decline in three waves, but still a decline.

MARKET BREADTH INDICATORS
Market Breadth Indicators - short term turned up, but nothing bullish the same old multiple divergences. The indicators has not been reset to suggest important low.
McClellan Oscillator - above zero with divergences.
McClellan Summation Index - turned up with divergences.
Weekly Stochastic of the Summation Index - in the oversold area.
Bullish Percentage - turned up, multiple divergences.
Percent of Stocks above MA50 - turned up, multiple divergences.
Fear Indicator VIX - higher lows and building divergences.
Advance-Decline Issues - in the middle of the range with divergences.
HURST CYCLES
Daily cycle trading - we have a cycle moving higher the price is above MA10 and RSI above MA18. For a short trade I want to see failed left translated cycle and RSI divergence.

Hurst cycles - the sine wave is 14 trading days long which corresponds to 20 day Hurst cycle. For the last several months it is running with pretty high accuracy. From the late August low you have 5 such cycles, from the October low 3 cycles. Neither bottoms is perfect for 80day/10w cycle low which needs 4x14 cycles. For now I will stick to my cycle count and I expect 20w cycle low the end of January(the arrow) with 8x14 cycles which corresponds to 2x80 daily cycles or one 20 week cycle.

Week 16, if we see a reversal next week I will stick to my cycle phasing, if we see continuation for another 1-2 or more weeks I have to change it to a 40w cycle low in October.
Tom Demark SEQUENTIAL AND COUNTDOWN - this technique spots areas of exhaustion.
Week 8 for the sell setup. If the next week closes above 3110 we will have finished sell setup and 9-13-9 sequence from the Dec.2018 low.

Krasi, why not impulse for wave 5 instead of ED? You favor ED because of Fibs? The current strength from the start of this daily cycle makes me doubt it will be an ED. Also the rise in Oct looks more like the start of a new 40w cycle.
ReplyDeleteI favor ED because we have two zig-zags higher... very well visible.
DeleteHi Krasi, I see many EW analysts say we are completing (iii). And we still have (iv) and (v) before this move from Dec 18 is over. What do you think of that?
ReplyDeleteI think this is wrong count.
DeleteThank you very much Krasi, very interesting the hurst cycles and the sine wave. Keep up with your cycle teachings :)
ReplyDeleteI am still searching for ways to track more accurate the cycles... the length vary, sometimes the amplitude is missing - it is not easy.
DeleteI have found some indicators we will see how good it is working...
I think this count can not yet be discarded at all
ReplyDeletehttps://2.bp.blogspot.com/-_udpBDQjN1I/Xb0b5Z42qoI/AAAAAAAAJVs/hnz9P2tMPbQQUDAmjXfEaFasdXR7yqz2QCNcBGAsYHQ/s1600/w414-6.PNG
I do not think this will work... time does not really fit... we have to see some crazy volatility.
DeleteHi Krasi, I truly appreciate your work and how generously you share it,but reviewing this year's posts I can't objectively agree with your method. I think you put way too much weight on what the market "should" do based on standard Elliot Wave theory.. constantly calling a top that never came. Anyone looking objectively at historic charts can notice periods of slow drifting without oscillations/waves, that cannot be predicted by EW while they happen, only to then be explained by EW with an arbitrary extension once they end. This is the huge limit of EW, a theory that is mostly subjective and almost impossible to backtest and study from a statistical standpoint.
ReplyDeletePlease know this is not a criticism, but an opinion that I am giving to stimulate a discussion. I see that - sometimes - EW can be quite accurate and perhaps it can be used within a larger framework that can identify when it's less likely to work.
As for the current market assessment I would be surprised if we immediately top: internals are quite good and the divergences you mention are minor. I also don't agree with the long term view. I think that most likely we'll keep drifting higher for a few more weeks, then we will see a corrective move for a few more weeks with a lower target between 2880 and 2980. After that I expect the bull market to resume quite strongly.
This is based mostly on time tested econometric models that I follow as well as on my reading of sentiment. I think that trying to predict exactly moves in equities is extraordinary difficult, so believe me I am not accusing you of anything.. your attempt seems honest and thoughtful. But I do think EW is inherently interior to models that have a strong statistical and scientific foundation; this obviously applies to longer time frames. Hope this will trigger an interesting discussion that will improve our trading! Thanks
EW is working fine, some can use it some can't. The most can't and of course EW does not work:)
DeleteThe biggest weakness of EW, it is not really weakness it is just how it is, is that corrections can take many different shapes and combinations and they are difficult to predict until you see most part of it.
For example "periods of slow drifting without oscillations/waves, that cannot be predicted by EW" - you see EW failing. I have different perspective - I see very valuable information this is just a correction. This is the important information and not how exactly an index will churn and turn.
Or take the current situation - in January 2018 two weeks after the correction has begun I wrote "by the time it is over, it would made me look like a fool many times". I wrote this because I know wave 4 a difficult to predict.
You see failed EW, I see that I could not perfectly predict b wave of 4 which is not easy anyway, but this does change the pattern. I see the correction running for two years following the plan and it will continue. You think because some guy(me) messed up EW does not work and there is no correction and this is your mistake.
Remember the perspective above - you do no see the forest for the trees. The correction is perfectly fine and running no matter if I was wrong for the exact path of this B wave.
You do not like EW, I do not like "funnymentals". When I hear someone explaining me about economic models.... I can only laugh. This has zero trading value.
EW is the only tool I know which can predict in advance that vertical move will reverse and retrace. All other tools are lagging.
Humans are emotional creatures and they are not rational. All this models expect rational behavior and we have the opposite case irrational(emotional) behavior. This is what EW is about. That is why it is better than any "funnymentals".
When you see the indexes 30% lower next year and you scratch your head what happened remember that EW predicted it and your models has not.
I have mentioned that wave ii for the ED is too shallow... it bugs me all the time.
ReplyDeleteI am starting to think that we have wave i and not iii of ED(white) like that - https://imgur.com/a/G9v84Fq
The big difference is time - a high before or after the holidays.
I think it is ED from 23 october. Wave 2 was 62% of wave 1, and wave 3 62% of wave 1.
ReplyDeleteWave 2 is ok because wave 2 (of ED with wave 1 extended) are very very very fast (Neely`s theory) and that's why I think the ED is right.
Now we must see the wave 4. It has to be around 38% of wave 3 and last the same as wave 2 or 62%.
And then the wave 5 that can be truncated or be a triangle to burn time
This Neely counts are too strange for me. I think the original EW theory is better.
Delete@Krasi Thanks for good work... Keep it up. Please, can you start putting time frame (Daily/Hourly/Weekly/Yearly) on chart. It's hard to understand which time frame chart is for.
ReplyDeleteIt is simple and it repeats every week for years:
Delete- short term is hourly chart
- intermediate term is daily char
- long term is weekly chart
- daily cycle chart is daily chart
- weekly cycle chart is weekly chart
As I say, they are pumping a lot of money, they don't care about economic, they see just the stock market
ReplyDeleteThis will not help....
DeleteYou write for the future, but for now this is the money that alew the up movement
ReplyDeleteWell, I hoped to stimulate a good discussion and I am disappointed that my models are "funny" while yours are so scientifically sound. Elliot Wave cannot even be backtested: why do you think it's superior to models that use sound statistical methodologies? I will keep using my models and I will definitely let you know if and when they turn south. I am sure that if equities don't drop 30% next year you will find a way to explain why your EW analysis was correct anyway. That's fine I guess, but not intellectually honest; exactly like it is not intellectually honest for you to pretend things went as predicted this year. Unfortunately I find many practitioners of EW to have something in common: they are not humble. I won't fail to give you credit next year if you turn out to be right. I hope to find the same level of honesty if you turn out to be wrong after so blatantly dismissing my work.
ReplyDeleteAll successful trader will learn to be humble anyway. Either that or the market would force the participant out of this game..
ReplyDeleteAmen!!!!
Delete1/3 position initiated here, trying to follow Krasi playbook. Fingers crossed!
ReplyDeleteYes, possible finished ED. To clarify again this is speculative entry betting on completed pattern without confirmation and this is not recommended. It is for traders willing to risk and not for those who will cry latter that it is someone else's fault:)
DeleteDon't worry I am not one of the trolls here.
ReplyDeleteJust to clarify for the others:) Bear in mind this could be w3 and it is possible to see one more high.
DeleteDo you have any other example of ED in sp?
ReplyDeleteI would like to check some things
I am checking different shares and this could be w3. Up moves are 3 and half days long... we can see 2-3 days lower for 14 day cycle low and w4, then another 2-3 days up for w5 and reversal with left translated cycle and short term divergences hourly and daily chart.
DeleteAnd some ED already finished?, from some time ago, I can't find any example
DeleteThis ED is not textbook one... it is more choppy. DJ show more clear picture and you can see it:
Deletethis way finished - https://imgur.com/a/hQNcgkV
or this way one more high - https://imgur.com/a/WPakDLF
Yes, I agree, wave 3. This would be my first ED.
ReplyDeleteFor months I have been looking at some possibles ED and nothing, they were another type of pattern
ED is not so common wait to see three waves(zig-zags) then bet on it.
DeleteAs per short term chart SPX around 3197... So can we see reversal from here as per short term chart.
ReplyDeleteAbove are the two options discussed, one more high looks likely.
DeleteWeekly RSI above 70, not sure how effective it is for Indices, but a great indicator in Forex that a turn is nye. Weekly timeframe only though from my observations.
ReplyDeleteThe federal save a bank, they print a lot of money
ReplyDeleteAll that maters is the pattern and FED can not do anything about that, they can not save anything.
DeleteIf august was 40w cycle low and sp goes down of 2820 for 20w cycle low in January, does it mean that the next 20w cycle can not make new ATH?, Because we will be already in the decline of the 40w cycle
ReplyDeleteIt does not matter August or October the pattern is almost completed and then multi month decline will follow.
Deleteok, but I follow counts of other indexes and there is a possibility of a last ATH before the big move down.
DeleteI like to have all the possibilities planned
that's why I would like to know about the cycles.
if sp moves down below 2820 it is already impossible to see new ATH according to the cycles
All indexes are showing 5 waves higher for c/B there is no other higher high - either reversal or not.
DeleteIf the price moves below 2820 the second 40w cycle will make lower low than the previous one, which means the cycle of higher degree 18months turned lower and we will not see higher highs before 4 year cycle low.
Hi Krasi. I've been having the same EW count as you for some time now. However I've been struggling to find an alternative bullish count if we do break higher. There are many indicators that I'm seeing that is saying we're not ready to turn down yet, so I am open to the melt up scenario. How would you change your count if price continues to melt up?
DeleteLike I said 3200 will be hit. It's a shame I was made fun of the obvious. You wasted a whole year of trading looking for your low. I'm not sure what technical charts you guys are following. Don't expect a good pull back until 3300. I'm just trying to help. We are in the early stages of III. Yes, there will be pull backs but ignore at your own peril.
ReplyDeletexyz, don't waste your time: even when reality is the opposite of what should have been based on EW analysis.. a new count will come up that demonstrates that EW was correct anyway.
ReplyDeleteAnd don't you dare suggesting the opposite.. even the well-recorded and never ending list of tops that were called this year wasn't wrong: it was correct! We live in a world where many people believe the earth is flat so... unfortunately reality doesn't seem to count that much, in astrophysics or Elliot Wave
I think we have to see a little bit doun then one more high
ReplyDeleteIt can be stay in 3195-3200, then one more high to finish wave B or wave 3 like other think
ReplyDeleteI remember!!!
ReplyDeleteIf the Fed announced tomorrow AM they were immediately printing 30 trillion dollars to buy SPY over the course of the day I think that would matter. Everything matters. The turning point = the tipping point when algos can turn the market's direction...when the musical chair song stops playing and there isn't enough buy the dip $ left to stop SPY from breaking support level. No clue if that will happen tomorrow. Pt is only short when support is broken.
ReplyDeleteListen,
ReplyDeleteIt is not logical to say that nothing matters except the charts when clearly there are examples of reversals defined by fed announcement, brexit, presidential election. On the evening Trump was elected Krasi stated that markets do not move vertically. He insisted that market would revert and resume lower. Look at where we are now. Come on.
Look, you clearly seem to get some of the calls right but you can't tell me that you can outperform indexing by making tiny trades where you get some right and many wrong. It doesn't work that way. How much did you bet on the current trade? Compared to someone who is fully invested all the time? You insist how superior your trading results are but you are spinning your wheels. You get some right, sure.
In the end, you need to be honest with your results. If you are so good, publish your trades real time with amount you are trading. Lets see how you manage risk. How those decisions impact your bottom line. Show the people instead of hiding behind elliot wave bs.
One more high! LOL! Come on! Always one more high looks better.
ReplyDeleteShort term momentum just turned negative let'a see what happens next before dismissing anything..
ReplyDeleteI think something like 2 days lower for 14 day cycle low then a few days higher before turn lower.
DeleteAt the dayly chart we see wave 1 and 2 and 3, now 4
ReplyDeletekrasi uvxy prognosis?
ReplyDeleteI think 11-11,30
DeleteKrasi, in houerly chart ther is 5 waves doun, then 3 wave up til now, what do you think
ReplyDeleteI see just a flat line for almost three days...
DeleteThanks
ReplyDeleteWhat does this sideways action suggest in terms of waves, are we completing 5 or in 4 and expecting a break out to complete 5. Does it mean for sure that we cannot be in a 3 Wave?
ReplyDelete4 or 5 I can not say, this up move is very choppy their is room for interpretation.
DeleteThanks Krasi - does it rule out 3 though?
ReplyDeleteThere is enough waves for ED but it takes several days without reversal so it is more likely impulse and currently w4 something like this - https://imgur.com/a/5iUHSQz
DeleteFibonacci fits perfect for iii and 5, so I do not see 3 or iii still running.
The market breadth is getting better, it is difficult to think in big moves down
ReplyDeleteI think they stop to get energy to 3220
ReplyDeleteThere's the breakout, upwards we go!!
ReplyDelete2700 down in C
ReplyDelete2800 down in C
2900 down in C
3000 down in C
3100 down in C
3200 down in C
2700 to 3200, 20% up... And Next more.
No c, no C, no x, no X, no triangle, no diagonal ending, no down.
No Elliott, no Neely, no Frost, no count waves... Shit and líes waves.
Happy atleast this blog is free, think about paying money and they call down everyday and you wait. Agree EW analyst failed big time and doubt if this is a valid theory. I am sure when we go down, we will see EW analyst will come up and say they nailed it as it followed one of multiple possibilities.
ReplyDeleteKrasi I know you will say it will go down, I am sure bcoz of these comments but you said the same a month ago too.
I don't think the market will go down 30% next year as Krasi says. But if it does.. many people will owe him a big apology..
ReplyDeleteAs I say, they print and print, the economy is health, they knew somthing
ReplyDeleteEW is just after, not for the future
ReplyDeleteBut thanks to Krasi for his work
ReplyDeletele onde di elliott in un mercato normale forse funziona , ma l'america none' piu' un mercato non esiste piu' il libero scambio della domanda e dell'offerta , con la stampa di denaro ce solo domanda e sui grafici si creano estensioni su estensioni
ReplyDeleteYou are very wrong... EW is working perfectly fine.
Deleteno , se guardiamoi principi di elliot , non ci siamo , mi dispiace
DeleteYou are just another confused clueless guy....
Deletecoming from the guy who has been wrong all year LOL
Deleteanalista di questo blog , fa un ottimo lavoro , perche' lavora sulle divergenze sui zig zag di correzzione ..... ma purtroppo i grafici americani e anni e anni che salgono in divergenza e in ipercomprato ... e' un mercato a senso unico pilotato dalla stampa di denaro
ReplyDeleteThis is just another convenient explanation when someone has no clue and do not see the pattern.
DeleteThe FED bla bla printing money bla bla.
Potential fifth wave, after long sideway moves like a triangle the final wave follows - https://imgur.com/a/GAkOj6N
ReplyDeleteTo extend it you have to count strange small wave 2 red...
Europe EU50 looks in sync with the US markets and it should be the fifth wave - https://imgur.com/a/C8NZ0nI
P.S. Those who do not understand EW please do not waste my time
Krasi just ignore the trolls. Just to let you know that many here do appreciate your work, though we sometimes don't agree with you. I always like to look at what others are thinking, it helps us a lot to remove our biases.
DeleteHe is not really a troll just another guy which gave up:)
Deletedevi guardare in faccia la realta , elliott e solo una teoria, che alle volte funziona e alle volte no
ReplyDeletecio' non toglie che apprezzo il tuo impegno e il tuo lavoro
ReplyDeleteBy the sheer numbers of postings on this blog, we must be near a turn.
ReplyDeleteyou guys were screaming that months ago, hell a year ago. every time people start to disagree they are either trolls or a top is in. how many times can you be wrong? yes, the stock market will eventually go down. jesus its up almost 30%. do you think it will go up forever???? when it drops (yes it will) you guys will be screaming I told you so even though you been saying it for a year. this is getting stupid. you missed out on a 30% return on your money. don't sit here and say you didn't. your charts every week for a year is looking for 2200. if you made money then you don't even believe in your own system. if you did believe in your system then your broke by now or you completely missed making 30% on your money.
DeleteWhy do you care so much, it's a free blog, get over yourself!
ReplyDeletewhy do you care so much? is only your opinion valid? isn't the point of posting something on a public forum to discuss all sides? i see how this goes now. only EW is right and everyone else is wrong. sounds like avi gilburt nonsense. somehow he is always right regardless of the outcome. the market is going down, BUT it might go up.
DeleteYou just do not understand EW. The way it works is - if then elseif else. For you this is weakness to many outcomes for others a tree of possible outcomes and use it to build a trading plan with high probability and low risk.
DeleteI have posted recently how to cover many different trading outcomes to build or get rid of a position with low risk - it was exactly this logic.
You just do not understand it, your thinking is stiff and you are not flexible. For you there is tell me the future buy and wait.
That is why Avi is always somehow right - he lays out all outcomes he sees and waits for one of them to play out triggering a trade. Your thinking is one dimensional - tell me the future(the direction) period... it is not EW the problem, it is your capabilities to understand it.
But your system over the last year hasn't provided multiple outcomes. You have said for the last year the market will hit 2200 (with high probability). You have said multiple times a top is in. How is that not a EW problem? Where have you provided an outcome of hitting close to 3300 by EOY? I think anyone with reading capabilities can understand that your high probability has been off for a year. You said you use this high probability and low risk to make a trading plan. Well then the trader is under water by now or missed a huge opportunity. You can sugar coat it all you wanna. Instead of acknowledging it you say others are too stupid to understand. I understand you have said for a year that EW is showing the high probability that we pull back to 2200. That never happened. May never happen. Rather than say the count has been wrong for a year, the reader is just stupid and doesn't understand EW. OK. This shows me everything I need to know about EW. Thanks.
DeleteIn this case I would say yes the reader is stupid with zero reading capabilities.
DeleteYes the market will hit 2200 with high probability... in 2020 can you read? Or use your eyes?
I have never stated the top is in, less fantasy please.
Missed opportunity and wrong whole year the next clear lie - my forecast was multi month rally at least to 2900 25% higher - zero reading and understanding trolling is more important.
The same bullshit over and over for the third time - clear troll.
Entering short again with 1/3... the previous one was sold on FOMC day.
ReplyDeleteI was reading another elliott wave blog and he was saying that we should get an emotional spike and reversal, as the last buyers are the short sellers who can't take any more pain and cover at the top.
DeleteThis looks like nice spike I showed a chart a few hours ago and instead of small final impulse we have bigger one extended 5=1to3 with gap and the internal count have finished impulse too.
DeleteShares which needed to finish impulse like AAPL,MSFT have now the minimum waves... that is why I have entered short.
Hi Krasi, I have never shorted before and probably not ready yet to try it out but what is the cheapest way to short SP500?
ReplyDeleteNo idea I trade ETFs... probably options, but in this case you need bigger account.
DeleteThanks, I had checked a few ETFs, whats sure if there were other options.
DeleteWhat ETFs do you trade?
ReplyDeleteTriple ETFs - SP500, crude oil
DeleteI told you the other day. Never is ED, always another count. What a pity :(
ReplyDeleteI do not know for the market, but stupidity is hitting new highs for sure:)
Deletenon sono cosi sprovveduto da non conoscere EW come credi, certo non sono un esperto ,ma le basi li conosco .. E DAL 2000 che seguo la borsa https://www.tradingview.com/x/ZRdhlAza/
ReplyDeletehttps://www.tradingview.com/x/5co3bJpP/
ReplyDeleteJust stop Krasi. You have the wrong count for the love of God. We are in minute wave iii of primary III. Are you reading your comments? People EW does work. This guy just doesn't know what he is doing. It is a free blog after all. Don't believe the hype that EW doesn't work. You need to find a real group that understands the waves.
ReplyDeleteYour iii of III is joke.... instead joining some group(the herd) learn to think and count waves.
Deletekrasi what is your uvxy target thanx?
ReplyDeleteTarget is.... higher I do not see much to the downside.
DeleteVIX with divergence and positive yesterday and the indexes with finished pattern.
IMHO, you cannot predict targets for UVXY. If you bought it in the last few weeks, you will realize that it has a mind of its own. Based on the market, you can just predict direction. Absolute numbers, almost impossible to predict.
ReplyDelete