Short term - I see a wedge and a break out higher. RSI broke the trend line and we need a pullback to establish the new trend line. The move lower counts better as a-b-c and not as an impulse. To the upside - the cash index is not so clear, but the futures are showing impulse so we should see more to the upside after a pullback. It should be some pattern, which takes time. The retracement has just begun so the path shown below is speculation at the moment. As long as the red line is not crossed this move up is not in danger.

Intermediate term - RSI with double divergence and we have move up. I think it should take another 3-4 weeks for 20w cycle high. 2900 looks like a good target to close the gaps and to test MA200, resistance and 62% retracement.

Long term - some already counting completed correction(expanded flat) other trying to fit impulse lower(the bull market is over). I do not think that it is so simple. In a few weeks we will know more. Some EW thoughts:
- if the correction is over with a flat we should see impulse higher. Than this should be i/1/V... too big too fast for my taste - suspicious.
- the bull market is over - then we should see impulse lower. If this is 1 for five weeks than around the end of the year SP500 will be at 500 - unrealistic. Realistic is "a" and the next one big zig-zag below.
- big zig-zag from Feb.2020 is running and it is so bad - than this is b and should hit 50% retracement and stay below the 62% or zig-zag will be negated. There is no such pattern expanding W-X-Y so suspicious. No, it is not expanding triangle either.
- the retracement takes longer and reaches 62% Fibo level or exceeds it - probably X wave and we have combination flat+X+corrective pattern. For NDX and SP500 big triangle could be an option, but for other indexes it will not work so well.
Too much theory from trading perspective just wait for the important cycle low - higher low or lower low with divergence. This will be the low risk trade.

MARKET BREADTH INDICATORS
Market Breadth Indicators - some are showing strength so this move up should not be just three days wonder quickly reversed.
McClellan Oscillator - reached slightly overbought level after divergence.
McClellan Summation Index - trying to turn up.
Weekly Stochastic of the Summation Index - sell signal, trying to turn up.
Bullish Percentage - sharp move higher, reached 70 with a buy signal.
Percent of Stocks above MA50 - trying to turn up, it will take time MA50 is far away.
Fear Indicator VIX - elevated levels. I think it should drop more before we see another surge higher.
Advance-Decline Issues - sharp move up.
HURST CYCLES
Daily(trading) cycle - buy signal was triggered, the price and RSI broke above the MA. The first trend line was broken, probably pullback and break above the second one. The next move lower should be corrective and it is a buy.
Do not forget - this trigger is nothing more than flip switch buy/sell. You have to put it in the context of the price action and the expected price action is corrective higher for a few weeks. If you are not comfortable with that ignore it.
Overall 35 days is a good length for the daily cycle and I think the next one is running.
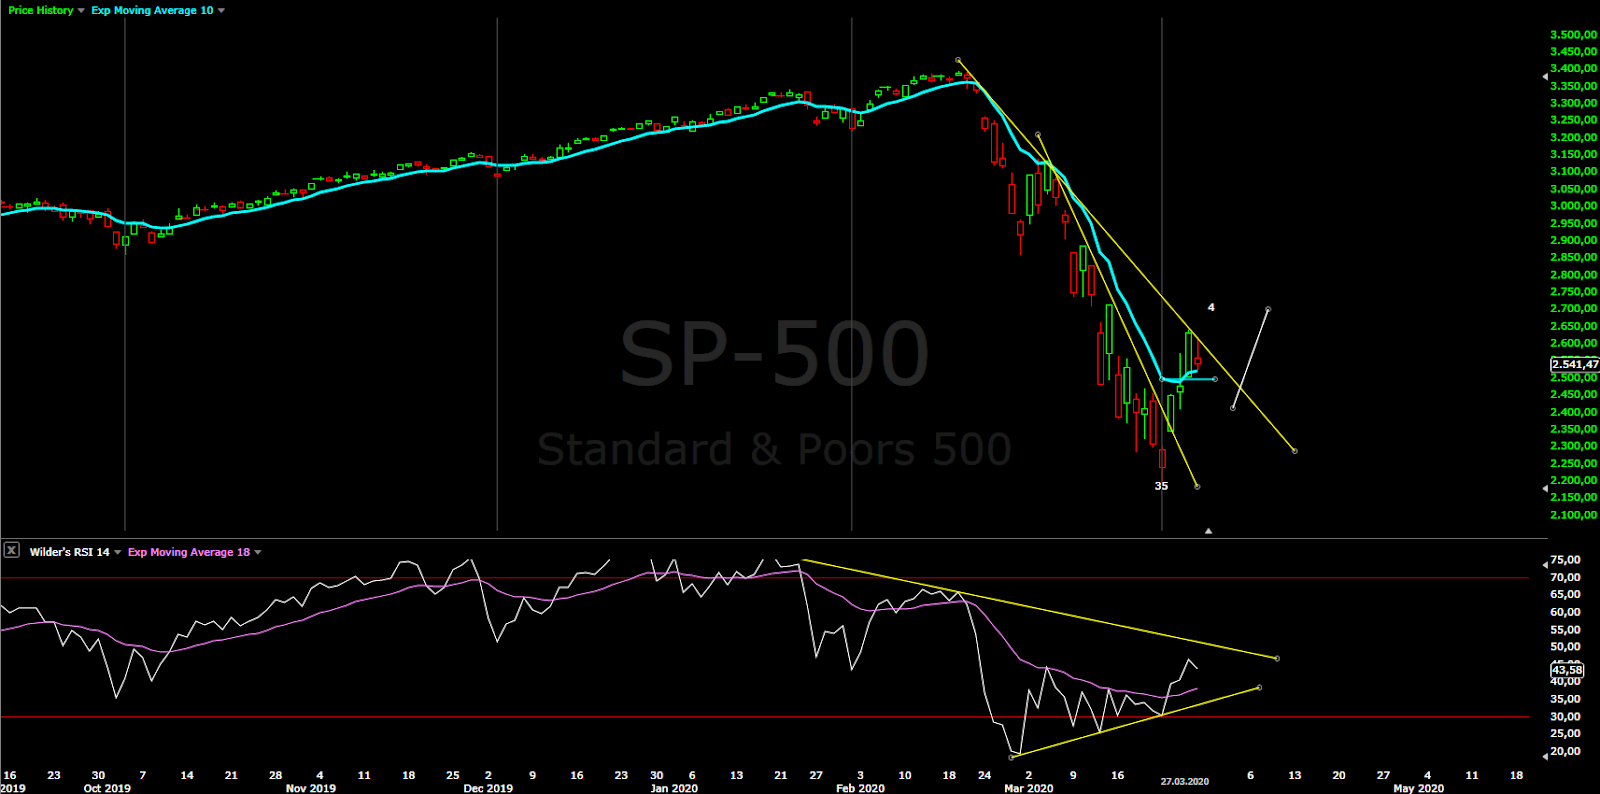
Hurst cycles - adjusted the sine waves to fit the price action. I think we have 10w cycle low and next we should see several weeks higher for 20w cycle high.

Week 8 for the 20w cycle. Strong move up - most likely we have 10w cycle low.

Hello Krasi,do you think Crude Oil After this double bottom could retrace till 34-35 After a new sell off?
ReplyDeleteI think we will see this levels after the correction is over.
DeleteI always appreciate your analysis, and will trade with it as my alternative. I do think wave 5 is possible only because every chart I see is making moves which are far much more extreme than any historical examples. For example the Dollar is just - wtf? Again I appreciate your analysis and every post is extremely helpful - thank you!
ReplyDeleteThanks.
ReplyDeleteI think we are making an X wave currently and will then go down into another zigzag. This is similar to Oct 2018 crash. They are both going to form double zigzags except the X wave looks different here because it is an expanded flat. I'm looking for a top around 2900-3000 than fall in a zigzag to 1800 area by mid-may
It smells like combination to me too.
DeleteSir Krasi (newly conferred title post Mar '20) -
Deletekindly clarify "combination"? I am struggling to keep up with your analysis on this point.
Thanks!
Combination is one corrective pattern, then connecting wave X(speculating this is running now) followed by another corrective pattern.
DeleteThis is EW theory, there is names for them I just call them combination.
Thank you! I am learning every day reading your posts.
DeleteKrasi
ReplyDeleteThankyou for your post. I am trying to learn EW from you.I can see that next move down is 0.5a.
What is a? From where to where?
Thanks
This first move up - on the first char a or 1.
DeleteNice update. I'm thinking along the same lines. The Hurst Cycle low should be in mid-June or so I believe. Until then it's a choppy move up with the current lows holding. I'm not an Elliottwave expert but it looks like a large ABC down into that June expect low. And the move up currently looks to be a large B wave, which ofcourse will subdivide into many smaller waves. Thanks any for sharing...
ReplyDeleteNo need to be EW expert or to like it. I wrote many times just paying attention if the move is corrective or impulsive is more than enough. Knowing if the trend reversed or it is about to continue is the important information.
DeleteAnd in the last few years I have started to use more and more cycles:)
Combining EW+cycle is so powerful it is incredible. What happened in the last two years is the proof.
Krasi,
ReplyDeleteI checked the lowest to highest point 2186 to 2637= 451 points< value of a
So I take 451-2= 225 points
Highest point 2637 - 225 points= 2412
That is the expected drop target before it reverse.
Am I correct?
Thankyou in advance
Yes, this is the idea. Do not forget this is corrective move which means - you can not predict the path exactly until it is mature. I am guessing that a decline should find support at MA50 on the hourly chart.
DeleteKrasi,
ReplyDeleteThankyou for your reply.
I am learning so much from you.
Krasi, the problem is MA 200 in the weekly chart
ReplyDeleteIn the dayle chart it's a bear flag
ReplyDeleteIn the dayle chart there is support in 2450
ReplyDeleteHi Krasi, Probably too early to ask but lower low with divergence is easy to spot as a buy signal. Higher low with divergence is a tough one in my opinion. With a higher low, you always think it will go lower but then it turns around and its a miss. What technique to use to determine reversal in case of higher low?
ReplyDeleteIt is always the same - the analysis says we should see a top/bottom and using the trigger(4th chart) as an entry. Those who are not afraid or have enough knowledge can start building position earlier - this is what I do often with this 1/3 before we have a signal.
DeleteKrasi, whay do you mean with "This will be the low risk trade", down from 2800-2900 to 2000 in June or up from June ?
ReplyDeleteUp from June after important cycle low.
DeleteIt looks like two zig-zags for a flat - https://invst.ly/qacjz
ReplyDeleteHi Krasi, the two zig-zag for flat above, is that what is already in place? 30/03 2450ish low followed by the move up to 2600 ... Or are you expecting another similar zig-zag early April?
DeleteTwo zig-zags already in place so either a flat above or a triangle - https://invst.ly/qais8
Deleteokay, so the 2650 test is done x2 and we go back lower towards 2500 in first week of April? Is that how I read the chart?
DeleteNow around the highs for better numbers in March and probably lower for the rest of the week.
DeleteWorst case should be flat to around 2450.
Thanks Krasi, spot on so far as usual. Well done!
DeleteSo it did not take long to get back below 2500. Already futures trading there Asia time today.
DeleteLooks like all the moves are getting compressed in shorter time frames.
Hey Krasi, any thoughts on Nat Gas?
ReplyDeleteOnly that I do not see signs for a bottom.
Deletethanks
DeleteWhat is the highest target that the sp could reach in April? 2700?
ReplyDeleteAround 2950-3000
Deleteand from there to 1800-2000?
DeleteNot necessarily, the decline could be over or more complex corrective pattern so anything from higher low to slightly lower low is possible.
DeleteI do not believe we will see another decline with the same magnitude more likely test of the bottom.
If the first impulse is complete, maybe the correction is as well - it got to the .382 fib. Guess we'll see, channel still valid - for me :) https://invst.ly/qav44 thanks Krasi
ReplyDeleteThis rebound until what day will it come based on hurst cycles?
ReplyDeleteI say this to know when we could have a good short entry for the final move down
If it continues to move with the same rhythm the high should be around 17-20 April.
DeleteI can not predict exact dates, this is how this sine wave above(the white chart) looks like.
Krasi,
ReplyDeleteLooks like you are spot on again.
Now it is a matter of 2450 or 2411.
We have the minimum, now we can only wait and see if it turns up again or it will take more time to correct.
DeleteThe futures - https://invst.ly/qb7j-
ReplyDeleteThe flat pattern looks complete with clear impulse lower. Lets see what happens next:)
Krasi,
ReplyDeleteAre you long now?
I am long from the bottom.
Deletenice Krasi.
Deleteyou called the 2600 zone perfectly last week for flat to 2450, just curious as to why you did not exit to re-enter.
In Europe I can not trade US ETFs. I can trade ETFs listed on European exchanges, but they have different working hours closing at 11:30 NY time. That is why I avoid trade lasting 1-2 days.
DeleteSometimes it can work sometimes not... because of working hours.
Thanks man. i am based in Asia, use IB and can trade global products 24x6 if access platform is your bottleneck.
DeleteBut yes, sometimes trying to over trade ends up missing the big picture move. So your approach is probably better!
I use IB. The broker is not the problem new EU regulations from last year is the problem.
DeleteI am sorry but it's not impulse, it was maby A, I cant see snp Go above 200MA and look the dead cross of 50MA the 200MA
ReplyDeleteI think we are going to see new all time low
ReplyDeleteI will be Very happy to be wrong and I very aprichiat your work
ReplyDeleteI think you are not taking into account time. You are saying in a few weeks the correction will be over. Time says in 2-3 months not now.
DeleteKrasi your opinion for eur/usd in this month?
ReplyDeleteNo clue how exactly it will look like in April.
DeleteThere should be more to the downside, but no idea how exactly it would look like.
Hi Krasi, what is your opinion on US10Y yield? Very strong divergence slowing building up on daily and weekly charts. Do you think it is close to reversal?
ReplyDeleteOne more up and down is possible. It is not 100% up.
DeleteThanks!
DeleteKrasi thoughts on BA
ReplyDeleteWill it go sub 100 according to you
I think 100 will be tested one more time, but after that everything is up for 2-3 years so probably BA too.... retracing 50% to 62% of the decline.
DeleteThank you
DeleteLove a duopoly
Hi, Krasi, what do you think about the long time trend now? As the covid situation gets worse, do you think the economy would look like 2008 depression? I recall you said the correction would be finished by the summer. Do you still hold the idea? Also would US housing market crash again with economy slowdown, job cuts and layoff, not to mention deaths... It seems everything is toward 1918 world epidemic and economy is going to be like 2008? Thanks a lot for your insight.
ReplyDeleteMy thoughts about the long term trend has not changed in the last two years. If you are not very old and you do not have health problems do not worry in the summer everything will be over.
DeleteThere is mass hysteria about a virus, which is worse than the virus itself. My opinion is this hysteria is organized with some goal.... to cover up something else.
Personal opinion - the financial system is broke, but blame the virus for all the loses and all the stimulus not because the system is broke. The CBs went nuclear and they will prop it for another 2 years then it is over.
Exactly, without a "crisis" it wouldn't be possible to introduce crisis measures, look how many controversial tools will be used from now on (CBs busing ETFs, corpo debt, bailouts for airlines etc, trillions for repo market) and no one said a word of protest....
DeleteIt was already trembling (dollar shortage and collateral issues manifesting itself in stress in repo market in September and December) with FED struggling to contain the situation with their existing "mandate" virus is a perfect cover, and call me conspiracy theorist but the signal it was going down the toilet was well advertised
Deletehttps://www.economist.com/printedition/2020-02-22
https://ritholtz.com/2020/01/dow-30000/
King Krasi! very well said.
Deletethank you very much for the insight. so we may have some irrational fifth wave in next few years before a real 1929 disaster? i'm thinking about us real estate market, fraid to buy house if it is going to collapse now
Deleteordinarily real assets would do well in an inflationary environment.
Deletebut thanks to CB no idea what kind of a bust this one will be.
Not really we should see alternation with 1929 - prolonged depression instead of short living crash.
DeleteIn a few months inflation phase should begin for 2-3 years I suppose the real estate market will be higher too. After that I expect two declines one into 2024-2025 rebound 2-3 years retracing big portion of the decline then the worst part into 2030. The perfect time to buy should be around 2030 right before the big inflation to begin.
I know it is not realistic to wait for so long. My advice is to have less debt as possible especially between 2027-2030 period.
Very insightful ideas. Just curious why not hold debt if there's big inflation? Usually US market loans are fixed rate for 30 years or so? If inflation comes, debt would "shrink" a lot in real meaning?
DeleteAt the end of this period maybe, but holding during it could be devastating... if you lose your job for example. Money will be the most expensive asset.
DeleteThe financial system will be reset. I do not know how exactly it will play out. The majority will lose their money this is the usual result.
can you ellaborate further when you say financial system will reset? Curious to hear your thoughts.. as their is lots of chatter about some even calling it conspiracy theory.. curious to hear your opinion..
DeleteCB meaning commercial banks?
DeleteThe system is based on credit expansion to infinity. Any contraction and it will implode.
DeleteWe have saturation and negative yields will not help.... plus demography is very bad in the western world. The credit expansion is coming to an end. CBs are fighting to keep it alive, but they do not have a chance against the natural forces.
Reset(defaults causing period of deflation) is inevitable. Every time the problem is getting bigger and bigger and they can not stop it.
CB - central banks
Don't worry about covid, we are in modern and clever world and investors, the problem is the fed and there printing, they have to stop, then every thing go natural
ReplyDeleteFood morning Krasi what do you think about european Banks? Now could be a double bottom before a brief up rebound?
ReplyDeleteMost likely flat correction so yes one more rebound.
DeleteThank you
ReplyDeleteHi Krasi!Thanks a lot for all the information you give us. Whats your opinion about Light Crude Oil? Thanks!!
ReplyDeleteCorrective move and one more decline for important cycle low.
DeleteThe same like the stock indexes.
Agree. Thanks!! Have a nice weekend!
DeleteKrasi, are you still waiting for up movement?
ReplyDeleteYes just this corrective phase will take longer
DeleteHi krasi.
ReplyDeleteGo down in indexes to Minimum in 3 weeks and go to ATH in V???
No V-shape recovery this time.
DeleteIf 5 August was 40w low, 22 march too and then 22 march 4 year low too ?
ReplyDeleteOnly if we saw the bottom. Not my first choice at the moment.
Delete