Short term - we have flat 38% lower(w), there is no reversal so probably wave x is running... it looks like combination for b wave. Watching 50% Fibo retracement and c wave with the same size higher. This pattern fits well with time another week lower for 20 day cycle low and another week higher for 20w high. If it so bad we will see continuation lower red.

Intermediate term - nothing new, watching for gap close and test of MA200.
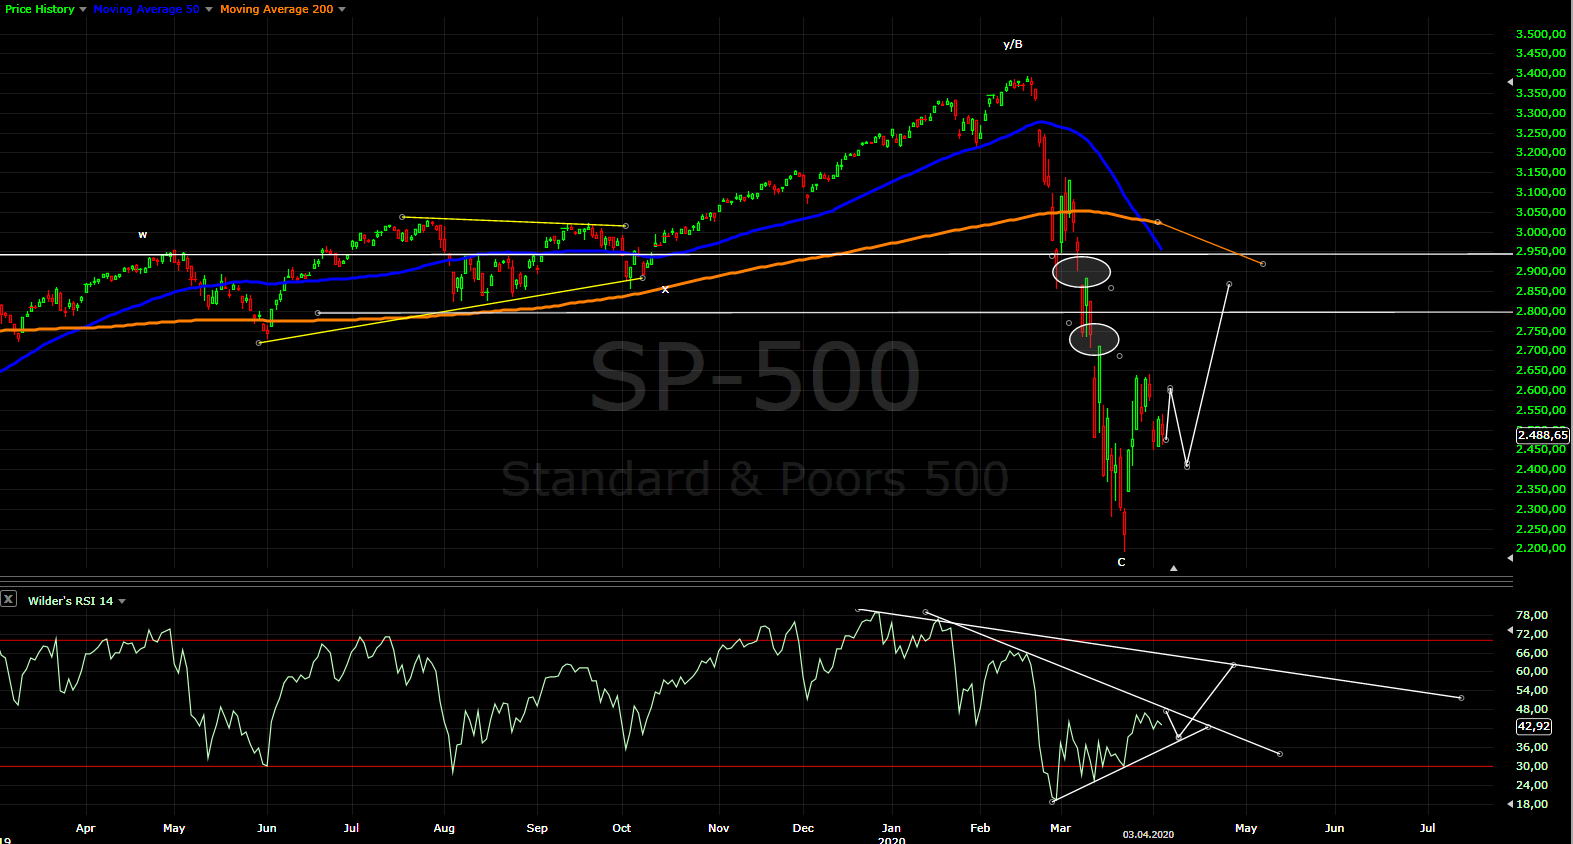
Long term - as long as the retracement stays below 62% the possible scenarios I see are: - A-B-C for a huge expanded flat - this could be the price low, but it does not feel right as a pattern. - W-X-Y - 2019 was X wave, what follows is another corrective pattern. Excluding flat - repeating March two more times looks crazy, so what is left is zig-zag(red) and triangle(yellow).

MARKET BREADTH INDICATORS
Market Breadth Indicators - trying to turn up with buy signals, but this is not a strong signal. The indicators are preparing for a divergences later.
McClellan Oscillator - around the zero line.
McClellan Summation Index - turned up with buy signal.
Weekly Stochastic of the Summation Index - turning up.
Bullish Percentage - wild swings.
Percent of Stocks above MA50 - trying to turn up, it will take time MA50 is far away.
Fear Indicator VIX - elevated levels. I think it should drop more before we see another surge higher.
Advance-Decline Issues - in the middle of the range around zero.
HURST CYCLES
Daily(trading) cycle - the price is trying to bounce from MA10 and brake above the second trend line, RSI will probably test the MA and the lower trend line before breaking higher. The trigger is buy, but as I said last week this should be just corrective move with one more leg up.

Hurst cycles - we saw 20 cycle high with length 16 days last week now we should see 20d cycle low next week. Ideally we should see two 20d cycles higher and the top of the second one should be the 20w cycle high.

Week 8 for the 20 week cycle. The 10w low looks confirmed, we should see a few weeks higher for 20w high and move lower into the 20w cycle low.

We are making a zigzag. But you're long-term larger degree count is incorrect as you will see. We are heading much lower to first 1800 and if that breaks 1600. This would be very deep for a 4th wave and is unlikely. I think this is whole move from 09' is a B wave and this is a the X' leg or b of B we are currently in of the B wave.
ReplyDeleteI know some say this is too large to be a B wave, but there is no rule in EW theory that states a maximum.
The rule is w4 testing the low of the previous wave 4 of one degree lower - 1800.
DeleteThere is rules for B maximum size - 2,618. It is already bigger than 2,618... B to infinity is nonsense.
Thanks I will pass and stick to the rules.
it's funny that we have 10+ years B wave... then every wave can be B wave?
DeleteWhere does it say B maximum size has to be 2.618? that is a guideline not a rule and plus if we go by NYA the B wave has not yet reached 2.618 size, so alot more to come.
DeleteTime is meaningless without context. Look how long the B wave from 2019-2020 was compared to the A wave from Oct 2018-Dec 2018. Alot of people thought we were in a wave 3 and forget about what happened in 2018. B waves are designed to confuse the masses and people think it's the beginning of a new bull market.
If you want to a proper count you have to look at everything since 1929. 1929-1932 was Supercycle wave 2. 5 waves up from 1932 bottom gives you 2008 as a top and supercycle wave 3 occurred from 1932 to 2008. 2008-2009 was A of supercycle of wave 4 and we are still in B of supercycle wave 4.
Count what you want. I have heard this B wave theories long ago and my opinion about this neo waves is - bullshit.
DeleteWave A 1 year and B 13-15 who knows how long is a nonsense - time matters.
Here is my take: from the 2009 low at spx 666 to 2018 high is wave A of W5, from 2008 to the coming low in 2020 is wave B of W5 that can retrace as low as 61% of the move from spx 666 in 2009. Following this year low, it should be followed by waves C, D and E for complete WAVE 5 over the next 5-7 years. Krasi's comments are more than welcome. Thank you for the great work you share with us.
ReplyDeletecontinuing my scenario (by the way I am not the same anonymous as the one above), 2020 would be an 18 year hurst cycle low from the 2002-2003 low, instead of a 9 year cycle low.
DeleteAre you not saying the same thing here 61% of the 2009 move would be 1750ish, the scenario Krasi outlined as 1800,...
Delete61% retracement from the January 2018 high at 2870 (I am assuming an irregular waveB retracement that will bottom this summer) to the 2009 low of 666 is roughly 1530. if we get there this summer it will invalidate the w4 scenario and confirm the wave B of an ABCDE final W5 rising wedge. this would then take 5-7 years to complete the remaining C, D and E waves instead of 2 years. it would also confirm that the 2020 low is an 18 year hurst cycle low and not 9 years.
DeleteLets wait and see what happens in May/June.
DeleteI meant ..from the 2018 (not 2008) high..
ReplyDeleteHi Krasi,please a comment on Oil and Natural Gas.
ReplyDeleteNothing changed correction higher and final move lower.
DeleteGold still going down?
ReplyDeleteThe cycle is lower for everything.
DeleteHi Krasi, a few follow up questions related to your comments from last week.
ReplyDelete1) You mentioned "The system is based on credit expansion to infinity. Any contraction and it will implode."
What causes the system to implode based on credit contraction?
2) "I expect two declines one into 2024-2025 rebound 2-3 years retracing big portion of the decline then the worst part into 2030"
I understand these are just predictions but what are they based off?
3) What can a common man do to avoid getting wiped out over the next decade if your predictions were to come true? :) Crypto world thinks bitcoin is the answer but would like to hear your perspective.
1) read about how money is created and fractional reserve banking and you will understand why.
DeleteIn short FED does not print money, FED gives a loan so there is debt and yield to be paid. More money is owned as created and more money/debt must be created and so on to infinity. As long as debt creation grows it works when it starts contracting everything implodes exponentially.
The system is doomed by design, but it makes very rich those who control it.
2) They are based on cycles and most likely pattern.
3) trading not buy and hold and from 2030 buying precious metals.
Maybe this decline is too big for wave 4, but instead of counting infinite B waves or mega diagonals I would rather count that the bull market is over. NYSE/RUT give better perspective for this idea, this is RUT(IWM) chart - https://imgur.com/a/eB2NNyB
ReplyDeleteBull market is over. C wave will take to new lows.Thats it. People say one more wave to finish 5th wave but I dont see it. from 1800 to 2000 is my target for the lows.
ReplyDeleteAfter the lows we will see one more high then it will get really ugly.
DeleteKrasi, crude oil is now in 4 of C to 32-36 and after the wave 5 to around 15?
ReplyDeleteI would simply wait for the end of May/early June.
DeleteFor an alternation and to fit with time it will be good to see flat or a triangle which means not much higher than the current levels. For w5 I do not know...
Sentiment is very bearish rn, exactly what you would expect near a low. I expect one more low around 1800s then rally for 1 year to new ATH.
ReplyDeleteYou can count a completed impulse from 09' lows or count it as a more complicated combo corrective structure. Either way we are almost done with the correction from Oct 18 highs and will be in another leg up by May.
Bears will be disappointed once again if they expect a continued collapse and crash. The big crash won't happen until atleast 2021 imo.
I expect the 2nd half of the year and the 1st half of next year to see the economy completely opposite from the stock market like never before. The stock market will continue to go up while there are going to layoffs, bankruptcies, etc.
I fully agree, even if the bull market is over we will see another ATH - I have shown this on the bearish chart RUT above.
DeleteThe difference is where the high will be below or above 4000.
It seems the idea for x wave is working - https://invst.ly/qctlp
ReplyDeleteI am counting x because the start is choppy corrective and less likelxy to be the next run up. Look at RSI - zig-zag lower and zig-zag higher.
Overall we have sideways move for 7 trading days already and the probability, that the next leg lower is running, is very low. Most likely we have bullish flag.
Thanks Krasi, that seems sensible option. Do you see the bullish extension till 2750 or 2950 before the next move lower?
DeleteWe can only wait and watch - first at what level this pullback will be completed and then add 100% Fibo which is the most common. If we are lucky it could extend 161% and if we are not so lucky only 61%.
DeleteCurrently it looks like 50% retracement lower to 2400 and 100% higher is around 2840.
Thanks man looks like it wants to get to 2840 first. I still agree that correction running and we see 2400.
DeleteHope you exit your longs after the cash pop yesterday.
Incidentally I had exit too, a tad early as usual.
Hi Krasi, would you still be long considering the w-x-y pattern that you posted? Just curious to understand the strategy.
ReplyDeleteUsually it is not necessary. For some it could be ok, for me it is too much trading. Most of the time this corrective moves can not be predicted accurately. If I want to squeeze more profits I will just add more at some low of the pullback.
DeleteCurrently the situation is very volatile, the moves are very large, against the trend so taking profits is not a bad idea. I have closed my position, if my analysis is confirmed I will go long again. Another option is to close half of the position.
The risk is overtrading the indexes continuing higher... I can live with that.
Thanks for taking the time to reply, it matches what I had expected.
DeleteKrasi, would today qualify more as a B wave with a C down coming? thank you
ReplyDeletesomething like this? https://invst.ly/qd3lb
DeleteOr like this https://invst.ly/qd790
DeleteSo basically same idea as your x wave, but deeper. I see people saying this is going to 2900 but I would think we need a pullback first to give it more time?
DeleteHi Krasi, is there an invalidation level for an alternate (upside) scenario to open up? Say above 2650?
DeleteI don't want to react looking at overnight futures action, but there is another strong move up above 2650.
I see a-b-c hitting resistance around 2700 and c=0,618xa.
DeleteThis is the "if we are not so lucky only 61%" scenario.
Thanks man, would you venture playing this from the short side?
DeleteI can sense FOMO on the tape today btw ... although could last till 2800 given the pace.
No, I am waiting. It is guessing phase now - is it a-b-c and if it is, is it part of something bigger.
DeleteKrasi it's not open
ReplyDeleteHi Krasi, is it possible that the March low was a Hurst 40 week low and the final 40 week low for the 4.5/9 year is in November of this year? Thank you for all your great work.
ReplyDeleteKrasi,
ReplyDeleteI was looking at EW book to learn from you.
I saw a pattern of corrective abc move.
I am just a learner.
Could we be in the C wave up following your Hurst cycle and drop in May following the Hurst cycle you proposed?
Always grateful for your feedback.
It looks like a-b-c now waiting to see what happens next.
DeleteKrasi,
DeleteThankyou for your reply.
I was reading the EW book and it says corrective waves always fully retrace.
If this is really abc wave which is corrective, does it mean that will will need to go back to at least 2200 the pint where it began?
Yes, unless it is part of a triangle.
DeleteTeacher Krasi,
DeleteThankyou very much for the education.
I promise not to bother you too much.
https://invst.ly/qdgwa Krasi, if you don't mind - is this the idea (is we continue lower)? Is the labeling correct? I'm studying EW daily, and the patterns I understand, but sometimes my labeling is incorrect. Thank you for any help as always!
ReplyDeleteThe link is not opening
Deleteyeah, there's something wrong with the site - try this please https://imgur.com/HuwIcGZ
DeleteFrom what I read there is complex correction with small x wave and large x wave. The first flat 0,38 is ok the second one is something in the middle like 0,62 in the book there is no such X.
Deleteah ok thank you, I check more closely - thanks again!
DeleteNow with another move which looks like zig-zag I can only guess - https://imgur.com/a/mo301pO
ReplyDelete- bullish green - a-b-c with c=1,618xa or double zig-zag w-x-y with y=w
- bearish red - the next leg lower begins
- zig-zag part of bigger sideways pattern flat(yellow) or triangle(white)
Pick your choice:) imo sideways pattern fits the best with cycles.
As long as this support holds the green scenario is possible - https://invst.ly/qdqq2
DeleteIf it is broken watch the bearish or sideways scenario.
Krasi,
DeleteCannot open the green scenario website. Maybe it it is my problem.
The green scenario is shown on the first chart. The second one is nothing special showing correction to support the last lows around 2450.
DeleteThe cycle is up?
ReplyDeleteWhich one? We should see lower for a few days for 20 day cycle low, but higher for 20w cycle high... at least I think so. All this before final move lower for 20w/40w/18m/4y cycle low.
DeleteThanks
ReplyDeleteFor 20W cycle high, how many weeks?
ReplyDeleteAt leas this and the next week.
DeleteSome people says that march was 20w low of 25 weeks, is it possible?
DeleteI do not think it is possible. I have explained a few times why I count the 20w cycles this time.
DeleteI do not remember why you said that
DeleteMega bullish cycle running 19 weeks higher and suddenly for a few weeks retracing all the wave below the previous 20w/40w/18m cycle - this is not how it works.
DeleteStrong right translated cycle is followed by another one making higher high and this is what happened. One cycle with 17w length the next one making higher high and collapsing after double top because the long term cycles like 18m/4y/9y are pushing lower - this is how it works. This is the way cycles behave.
thank you very much, 4y low end March or beginning June
DeleteYesterday we had very bearish reversal candle, but today no lower opening and no follow trough so the reversal is negated. The probability is higher that we have corrective move and one more high - this is what we should according to the cycles which I follow.
ReplyDeleteFor some indexes(NDX/SOX/XLY) the low can be counted on 18.03 so here is one possible pattern - https://imgur.com/a/H0sQQOH
As long as the price stays above the red line I will watch this.
Why not now wave 4 of c of B?
DeleteBecause I did not see it:) It is possible
Deletekrasi how high we go before a drop 2800?
ReplyDelete2786 is the 50% retracement
DeleteProbably lower for the rest of the week and 2800 next week.
DeleteAlready 2800 boss. everything is getting compressed in timelines
Deletenot enough?, well I took a short at .5 fib just in case https://invst.ly/qecwd
ReplyDeletesite still slow - try this https://imgur.com/2GsPB5T
DeleteYes, now looks like completed a-b-c.
DeleteSmall short and we see what happens.
Deletethanks Krasi
DeleteThe March low is looking more and more like a 40 week low, way too powerful.. thanks to the Fed albeit.
ReplyDeleteThe amplitude does not define the cycle it is time. Do not get fooled again.
DeleteI am not saying the LOW is in far from it. I actually think more bearish than most. My previous target of 1530 has not changed. But there is a possibility that the LOW will come in November but not before testing the 2950-3050 level first over the next 4-5 weeks to squeeze the shorts. Just to clatify my point.
DeleteYou are saying - wave A 4 weeks, wave B 3 weeks or 10 what ever and wave C 7 months.
DeleteThis is not possible, this is 100% wrong.
I am saying wave A was 5.5 weeks, wave B could be roughly 7-12 weeks from the march low and wave C down could last into September/November
DeleteExactly such proportion between the waves is not possible.
DeleteI think it is possible. I have seen many fractals as such in the past 150 years. But then again I may be wrong completely. Lets see.
DeleteHi Krasi, in the last chart that you posted, you were hoping SPX to rise to 2900 level in another 2 weeks. So why would you short now, especially if your original thinking was that a high after mid april makes more sense?
ReplyDeleteAlso since you trade longer time frames, do you think SPX is headed back already to test the low?
For fun:)it could easily drop 250-300 points and if I am wrong it will be a bonus.
DeleteLol... lets see who wins, you or the "fed printer". ha ha:)
ReplyDeleteDoes FED printing matter or not? Does this virus matter or not? I am getting confused now:)
DeleteMy bad..only price matters. Nothing else matters.
DeleteVery interesting blog and thank you for sharing your thoughts and ideas. I've been here before many times but just realsied that you are the same Shushumiga who comments sometimes on the WaveTrack blog (Peter seems to have become something of a contrarian indicator these days!). If you are ever interested in looking at my attempts at analysis/ EW counts I post my ideas as tomj2417 on the TradingView website. With all the things going on with the world it is more important than ever to get these things right and protect our capital as best we can. All the best.
ReplyDeleteThanks! Peter is ok, if I have to choose whom to pay for analysis, I will choose him.
DeleteJust like the majority he ignored the market message and chose to see what fits to his view(inflation pop). I still do not understand why experts, which should know better, ignored the pattern.
I have to admit the pattern is really very challenging and still not 100% clear. It begun in 2018, the market is crazy and in the next years it will not get better. I think we have to get used to moves with huge amplitudes.
Hello Krasi please, can you leave a comment after Opec's cut on Oil? Do you think could return back to 18/20 for the V wave?
ReplyDeleteI do not care about news... they does not matter. It is the mood which drives the markets and it is bad now.
DeleteMy guess was sideways move until we see the final low later according to cycles - this is working so far and I do not have something new to add.
Thank you very much. Good Easter to you and your family.
DeleteHi Krasi ,
ReplyDeleteWhat targets we have on oil is it gonna go lower even after the Opec cut deal . As the fed pumped stock this week do you think we ever gonna see lower stocks like we did in march ?
The same like above it is the mood FED does not matter.
DeleteI do not see complete pattern. The price low is in only if we have triangle.
Crude oil maybe 17-18
The March low is looking more and more like a 40 week low if not an 80 week low from the December 2018 low. we'll see..
ReplyDeleteNice move by the Nasdaq yesterday for bulls. A 5% move to the upside for Apple too. The problem with EW for me is that you can produce both bullish and bearish outlooks just as easily, Like this one.... https://www.tradingview.com/x/fbHChyar/ . FOMO really starting to burn......😐
ReplyDelete