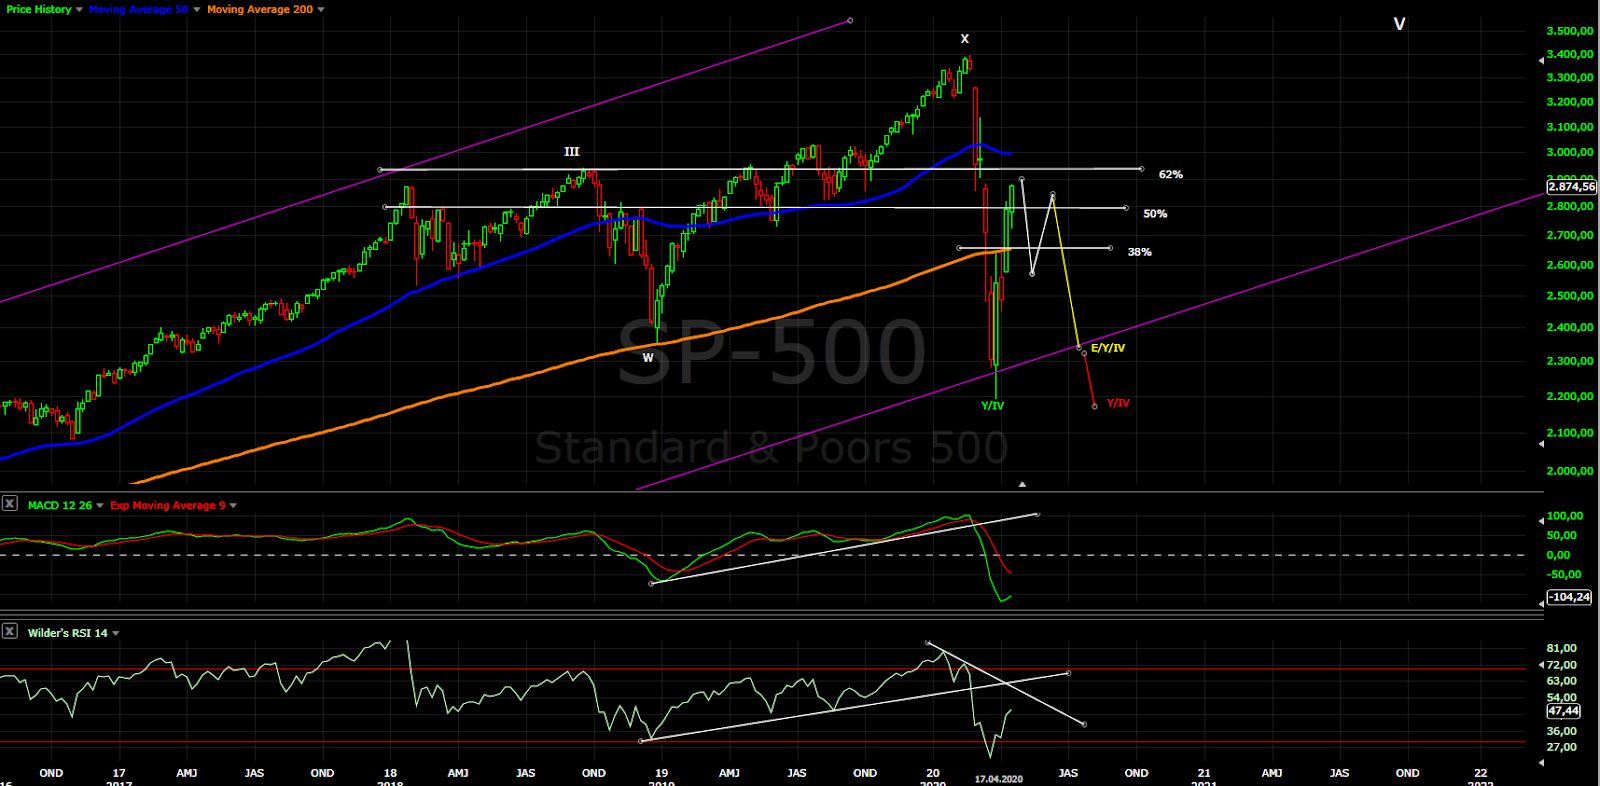
Short term - I see zig-zag with wedge shape so next we should see something lower. The wedge in 2019 did not end well, big portion of the wedge lower is retraced, lets see what happens with this one:) Waiting for the move up to be completed then I expect at least 50% retracement to support and closing the gaps.

Intermediate term - the second gap and MA50 tested, now I expect to see at least a pullback. I have the suspicion this is another x wave... the implication is there is no need to see lower low for complete pattern.

Long term - waiting to see how the pattern will be completed. I can only guess now... statistically the red one is most common - most bullish option we saw the low(green) - what I miss is to see impulse higher... - most common corrective pattern is zig-zag(red). - triangle(yellow) is an option too, but it does not work for all indexes.
MARKET BREADTH INDICATORS
Market Breadth Indicators - showing strength, but I am expecting the real buy signal after divergences.
McClellan Oscillator - short term divergence.
McClellan Summation Index - buy signal.
Weekly Stochastic of the Summation Index - buy signal.
Bullish Percentage - short term divergence.
Percent of Stocks above MA50 - now above 25.
Fear Indicator VIX - still too high not buying this rally. I am waiting for divergence.
Advance-Decline Issues - still below the trend line connecting the highs and has not reached overbought level.
HURST CYCLES
Daily(trading) cycle - buy signal, but day 41 high-to-high. It is mature so not the time to chase it higher.

Hurst cycles - high-to-high we should see a top according to the sine wave and it is possible to be 20w high. Low-to-low I was expecting pullback for 20d low, which played out as sideways move and now the next 20d cycle is running. I expect to see similar M pattern like in Jan/Feb with the 20w cycle - right translated cycle the next one making slightly higher high and turning lower. So topping next week and decline into 40d cycle low.
The 20d lows are not so clear, most likely the 40d cycle is dominant and the sine wave follows slightly shorter 40d cycle.

Week 11 for the 20w cycle. Heading into 20w cycle high after that we should see a decline into 20w cycle low.

Tom Demark SEQUENTIAL AND COUNTDOWN - this technique spots areas of exhaustion.
The same price action like on the way lower - failed setup meaning no impulse followed by completed setup with histogram divergence.

I don't think we should be looking to the SPX for a good EW count. The SPX has alot of tech companies that I think makes it overly bullish even when it should be bearish messing up the count.
ReplyDeleteI think the best way to count waves in the market is to look at Russel, NYA or even Nikkei. Nikkei is the best example it shows clear 3 waves that began on Jan 20th and now in the 4th wave. This is clearly not seen in the SPX.
It is true, SP500 looks much stronger than other indexes because of the tech stocks. I have said that last year not to trust this "strength".
DeleteOn the other side I do not think that the patterns are different. I do not think this is w4 even for the Nikkei or RUT more likely x. We should see another leg lower which will look like the fifth wave, but I bet it will be a corrective structure.
Nikkei, 3 clear waves? I can see a series of 3 wave corrections since Jan, 2018 and I can see a 5 wave pattern since Jan, 2020. But that's just me I guess.....
ReplyDeleteWhat do you think about CV stocks like APT, IBIO, and CODX? DO you think there is one more wave up left? They seem to go inverse the market.
ReplyDeleteYes, one more leg up looks more likely than decline.
DeleteHi Krasi, has your opinion changed about crude oil since last week? There is a lower low now with strong divergence on daily and weekly timeframes? It was odd to see all oil stocks jump towards the end of the week when oil was at the lowest price.
ReplyDeleteI have not changed my opinion waiting for the cycle low late May/June and not trying to guess the pattern. It does not look finished anyway.
DeleteKrasi,
DeleteThankyou for your latest post.
I understand you are expecting S&P a down and up and final down, which may or may not be a lower low.
Timeline wise do still expect all these to happen by end May/ beginning June ?
For now I do not see a reason to change the timing.
DeleteFor the pattern we have to see the move lower to confirm the next leg lower or more sideways move.
Krasi,
DeleteThankyou for your reply.
Krasi, the snp arive to the top for now? We arrive to the top up cycle
ReplyDeleteThere is beer flag in the vix, don't you think we are going to one more high?
ReplyDeleteThe short term pattern is not so clear. I looks like topping to me.
DeleteWhat does it mean that USOIL goes to 0? Is there any good ETF to trade for USOIL? USO is not following USOIL.
ReplyDeleteI don't think you can or should trade it. If I am not mistaken USOIL is CFD (contract for difference) instrument based on front month CL future contract, so it is a derivative or a derivative. The underlying MAY contract went negative today due to speculators not able to accept WTI delivery, and paying to get rid of the oil. CFD cannot be negative by definition hence it stopped at zero. USO/UCO and other crude etfs hold combination of 1nd and 2nd month future
Deletehttp://www.uscfinvestments.com/holdings/uso
BTW all other ETFs that track anything else using futures contracts work exactly the same, i.e. commodity, volatility (VXX etc)
DeleteRegards,
Mily
I do not see a good ETF in US. I have traded ETFs from WisdomTree listed on EU exchanges. They seem to follow good Oil. Look at their page if you can trade on other exchanges.
DeleteIf you are not in the US watch out with taxes too - for some of this commodity/volatility ETFs like USO/UVXY you have to file 1042 in US I do not touch them.
https://www.zerohedge.com/energy/uso-halted-worlds-biggest-oil-hedge-fund-manager-warns-etf-may-implode
DeleteKrasi, the doun cycle is going till June?
ReplyDeleteIf it has the average length yes. If it is shorter is the second half of May.
DeleteAt this point, I am guessing every Tom Dick and Harry thinks market is overvalued and wants to short the indexes. Next few days should be interesting. Krasi, since your criteria (completed pattern, time) is almost meet, would you enter short or wait for confirmation (drop below MA10)?
ReplyDeleteI have a short so waiting for confirmation.
DeleteI do not agree the experts now explain how much higher we will see, V shape recovery.
There is a lower low now on SPX. Break below MA10. A lot of key stocks also breaking below MA10. Would you consider this confirmation?
DeleteYes, sell signal is activated.
DeleteWhen was the 10 week low?, 23 march or 3 april?
ReplyDeleteI count it on 23 march.
DeleteDavid F thinks 3 april ...
DeleteFor David lows never matter... just the theory should look pretty.
DeleteYour opinion of the eur/usd from may to end 2020?
ReplyDeleteImportant low May/June then higher.
DeleteI think it is becoming clear day by day the scale of dislocations 10 years of printing has produced, repo, CLOs, ETFs (today USO will probably implode), WTI etc
ReplyDeleteand USO is gone....
DeleteI am not surprised... I wrote I expect system reset in the coming years.
DeleteIt has began in 2000 and now we are seeing the beginning of the end.
USO was briefly halted, but it is back trading now.
DeleteBut i get what you mean... maybe the Fed will backstop oil too, can buy at negative price these days i hear :)
I said my wife today only if I had a spare oil tanker in my back yard:))))
DeleteThe more money are pumped the more problems are poping up.... until the system implode under its own weight.
I was so ready to start digging a big hole in the backyard to store some oil. But then the wife said, we aren't going anywhere for one year :-)
DeleteKrasi, you have a wife? i thought you were married to markets! :)
Deletewhat do you mean with "system reset" ?
ReplyDeleteThe financial system is based on debt which has to grow for ever. If it shrinks and the system will implode.
DeleteSaturation point is reached even negative yields does not help. In the coming years we will see a lot of debt destruction until the system is cleaned up to sustainable levels or we have new financial system or combination of both.
Sounds simple, but it will be a bad depression.
inflation?
DeleteFirst deflation, debt destruction will make money more expensive. Money is debt(read how FED creates money and fractional reserve banking).
DeleteAfter that comes inflation... high inflation.
how can we protect our money?
DeleteFrom 2020-2030 trading up and down not buy and hold. From 2030-2040 buy and hold precious metals/gold miners. This is what I will do.
DeleteSorry for my bad, it was OIL etf that is being terminated
ReplyDeleteOne more up and down for impulse - https://imgur.com/a/VkxnGtL
ReplyDeleteAt first it looks like impulse, but if you look closely and compare with futures it is double zig-zag. So I want to see one more up and down for w4/w5 to be sure this is impulse with big w3=2,618x1.
thanks for timely update, this is similar to what i am thinking
DeleteCV stocks are not rising with this drop as opposed to late Jan and Late Feb. I think this may be a bulltrap and we get one ore rally, but not confident.
ReplyDeleteKrasi your opinion on spxs I own from 11bucks your thoughts could we see 15
ReplyDeleteYes, 15 is possible. Minimum should be 14.
DeleteFrom your latest picture we should see one more up to 2850? Or that picture means not possible?? I thought you mean spxs should be lower first?
DeleteThere's no guarantee that that will happen either
DeleteThe picture shows how an impulse should look like not what should happen.
DeleteNow is waiting another day then we can make conclusion how the move lower should look like.
Russell will lose another 50% from here by mid September, IMO. Apparently, that doesn’t jive with Elliott Wave
ReplyDeleteNeither EW nor cycles support your analysis.
DeleteNow I really like my opinion
DeleteHi Krasi, can you recommend a good source to learn cycles? I couldn't find any good information on the 20wk, 40wk, 18m, 4yr cycles.
ReplyDeleteMastering Hurst Cycle analysis - Christopher Grafton
DeleteKrasi, don't you think we should see one more high for wave 5
ReplyDeleteNo,I do not think.
DeleteFutures looks like its retracing here - https://invst.ly/qj9z9 - Possible?
ReplyDeleteI can not count it as impulse, it is more likely a corrective structure.
DeleteWith one more low maybe, but at the moment is zig-zag.
so you are expecting one more higher high to complete the upmove (maybe to .618)?
DeleteNot necessarily, just the decline will be corrective.
Delete2805 at least
ReplyDeleteIf over 2820 then 0.618
ReplyDeletestill not sure if this wasn't just a C down with the current move being a 1 of 5
DeleteKrasi, a low as important as the of 4,5 year should not make a lower low than the March low?
ReplyDeleteYes, it is possible. We had already one very big and fast move lower. Now just waiting for the pattern to be completed.
DeleteWhat do you mean the pattern completed, one more high?
ReplyDeleteThe big pattern from February
DeleteYesterday 5 week low?
ReplyDeleteToo early for that
Delete20 days, like the average ...
DeleteDo you still think gold goes to $1400 in May or June?
DeleteYes, I think we are in the middle of the 40d cycle.
DeleteOne more high?
ReplyDeleteWe have to see the close today, but with this indicators higher high does not look likely.
Deletesorry. question about gold price was not a reply to previous comment.
ReplyDeleteTo change my mind about gold I have to see either the corrective pattern turn into impulse or long corrective phase to clean up the double RSI divergence.
DeleteUntil than a leg lower is more likely.
Hello Krasi,can i ask you a forecast on Tesla? Thanks
ReplyDeleteIntermediate term it looks the same like the indexes - from the high leg lower, leg higher and one more sell off to around 300.
DeleteThe big picture not sure about the pattern, but I think we should see final rally higher.
Hi Krasi,is a close below MA10 daily another confirmation for reversal? Would like up learn what to look for at this stage for another confirmation.
ReplyDeleteCloser look - https://imgur.com/a/RFpxljM
DeleteYes, close below the small blue line will trigger the signal again. If the break below MA10 was fake, the price should move higher and not close below the close price of the previous green candles.
Usually such "fake" break below MA10 is when we have strong right translated cycle and the down phase is short only a few days. This is not the case and the candle from today is bearish, testing MA50 and the broken trend line.
RSI has not triggered sell signal it bounced from its MA and I suspect it will break below it now confirming sell signal.
krasi you say that from 2030 to 2040 there will be inflation and what will be the behavior of the markets?
ReplyDeleteI do not know inflation does not mean down or up. I know the commodities should be in secular bull market which means they will have better returns from stocks.
DeleteThis shows the idea - https://www.macrotrends.net/1437/sp500-to-gold-ratio-chart
Until 2011 was the time to hold PM after that stocks.
1970-1980 2000-2011 hold PM the same will happen roughly 2030-2040 which does not mean SP500 must be down.
Krasi- would it therefore follow that stocks will remain in a secular bull market through 2030? I am particularly interested because you drew earlier in the year a chart suggesting the potential for new highs in the S&P either this year or next followed by a rather significant decline culminating in and around 2023. Do I have that right and is that still your base case? If so what is in store for stocks for the rest of the decade once they bottom in 2023? New ATHs before the commodity secular bull begins in 2030? Best to you.
ReplyDeleteNo, the stocks should begin secular bear market in 1-2 years and the leg lower 2024 will be just the beginning. After that higher for 2-3 years and again lower for 2-3 years - this is what I expect until 2030.
DeleteThank you for your insight.
Deletehttps://www.youtube.com/watch?v=b6G5Cx5IPnk&feature=em-uploademail
ReplyDeleteKrasi- I'm wondering, following up with your last answer to me-Is there a decade in the past that you could bring to our attention that may resemble what the S&P may look like over the next decade? Same question for gold although I know you believe it still remains in a bear market until 2030.
ReplyDeleteSP500 - this is difficult to predict, I guess huge zig-zag lower minimum 1500 from roughly 4000.
DeleteGold - I think it is big expanded flat. So it is in bear market but it is not a problem to see higher high with final devastating C wave in the period of deflation 2027-2030. Look at SP500 2018-2020 and you will get the idea.
Once again thank you. Getting very interesting.
DeleteGreetings from Texas, Krasi. Thanks very much for all you do to further the practice of TA, Hurst, etc. On daily DBA chart, mature ED formed, and soon to head north? Take care.
ReplyDeleteYes, it looks like ED. I think it is in the middle of w4 of it.
DeleteGood afternoon Krasi! Want to thank you for your great work and sharing knowledge and your thoughts with us. Have a nice weekend!
ReplyDelete