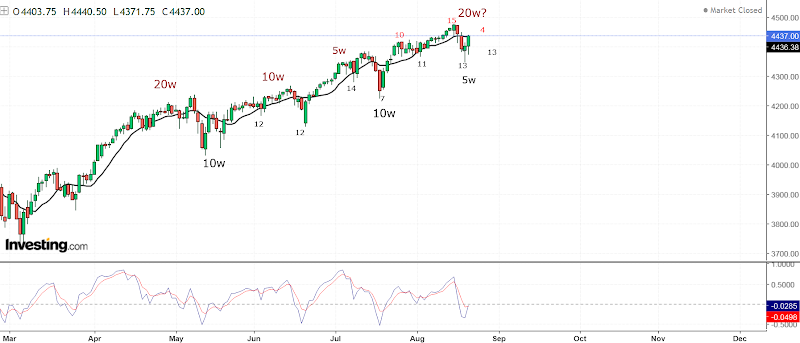
We saw a decline this week, the indices should be at 5w low. Now waiting to see what happens next week. I do not know if we will see a new high or failed attempt to bounce from MA50 and turn lower into most likely 18m low. According to market breadth the decline is just starting.
TRADING
Trading trigger - sell, it looks like MA10 cross and test.
Analysis - sell the rips, long topping process.
P.S. - for a trade both analysis and trigger should point in the same direction.
TECHNICAL PICTURE and ELLIOTT WAVES
Short term - zig-zag down and up, more price action is needed to talk about pattern.
Intermediate term - from the March low we have one big zig-zag consisting of two zig-zags, which itself consist of zig-zags. You can call it W-X-Y, but there is no impulses.
We have obviously overlapping waves, so if we see continuation higher the pattern should be some kind of ED for the last wave c/C/Y.
Long term - topping process running for months and maturing. Some kind of b-wave and c-wave will follow.
MARKET BREADTH INDICATORS
Market Breadth Indicators - turned lower again. I think the message is we need leg lower for intermediate term low.
McClellan Oscillator - below zero.
McClellan Summation Index - sell signal.
Weekly Stochastic of the Summation Index - trying to turn up.
Bullish Percentage - turned lower.
Percent of Stocks above MA50 - turned lower.
Fear Indicator VIX - spiking higher again. Convincing break of the trend line connecting the highs is needed to signal reversal.
Advance-Decline Issues - heading lower.
HURST CYCLES
Short term cycles - we have a decline into 5w low. Next we should see move up into 20d high. I can not say if the next 5w high will be a higher high or lower high... waiting for now.
The long term count is not very clear, there is no visible significant low, the indices do not show consistent picture so we will be sure only in hindsight where the 18m low is.
I talk about the current 18m cycle extending because of missing cycles in the previous one so here is one speculation - what happens if you put the previous 18m low where it should be in June.2020 and start counting? You will see three perfect 20w cycles and now in the middle of the fourth one. If we see decline into mid-October I will have to accept that the rhytm of time has not changed.
Subscribe to:
Post Comments (Atom)


Nice, thanks,
ReplyDeleteThe Dow seems clearer right now
ReplyDeleteHi Krasi, can you comment on why you think rising dollar hasn't had much impact on indices? At this point, it looks like there is more upside for DXY.. though indices aren't budging. What do you think has changed?
ReplyDeleteNothing changed there is no big moves in the currency markets just long sideways move.
DeleteTransports look ready to tank after a small retrace, whether the market follows or not it's the question. Doji on spx today might be a clue.
ReplyDeleteNDX now looks like another double zig-zag - https://invst.ly/vuvdr
ReplyDeleteAnd DJ will synchronize completing ED like this - https://invst.ly/vuvgs
DeleteLooks good Krasi - dip into the weekend , then maybe finally the high in early September..
ReplyDeleteSome are watching this ED - https://invst.ly/vv2y-
ReplyDeleteIn this case we have to see very sharp reversal like closing below 4450 for one day.
We could break out to 4502 here
DeleteKrasi, the S&P go out the canal?
ReplyDeleteWhich canal? This one https://invst.ly/vvxu1
DeleteWhat is your opinion on gold?
ReplyDeleteFrom the March low corrective sideways move. Long term when it is completed continuation lower or the next 2 years - https://1.bp.blogspot.com/-ACo9dylgFzk/YPVGx8n663I/AAAAAAAAK7w/s3xrQ0-pkLg0H9RFMcz4cA1N0CW-seGKQCNcBGAsYHQ/s1669/lt12-4.PNG
Delete