Dec 27, 2009

Japanese candlesticks / Японски свещички

Български по-долу

If you want to learn something more about Japanese candles I recommend you this book - “Japanese Candlestick Charting Techniques” by Steve Nison.

Or take a look at StockCharts.com – ChartSchool
Introduction in Japanese candlesticks.
Bullish candle patterns.
Bearish candle patterns.
Index of candle patterns.

Writing this post I assume that you have read already the book above or any book about Japanese candlesticks. You know already the most candle patterns or least the most important. It does not make sense to repeat all the information, which you can find in Internet.

The question is how to use the candles? Where is their strength?

Important things about applying Japanese candlesticks:
- Japanese candlesticks are not suitable for use as an independent trading system.
- Using only candlesticks - they have predicting power 1 to 6 sessions (following candles).
- Wait for confirmation – close above (bullish) or bellow (bearish) the pattern.
- Using them in combination with other methods is their strength. Then they are very useful.

My way to use them – “last nail in the coffin”.
What I mean? – Using technical analysis you expect something to occur – the beginning of a correction, signal in the direction of the trend after correction, reached levels of support or resistance – the system warns you of impending change of the direction.
When is the right moment for taking a position? – It is always marked with some kind of candlestick pattern. That is why candlesticks give us the last signal that it is time to take position. They give us the entry point and the level for the stops.
Aggressive approach is to take position after intraday brake above/bellow the candlestick pattern. Use it only in the direction of the trend.
Normally you should wait for confirming close.
Stops – one tick bellow (bullish) the lowest point of the pattern or one tick above (bearish) the highest point of the pattern.

Use Japanese candlestick in combination with other methods. Using them this way makes them very powerful tool.

I am using trend following system, so continuation patterns are of less importance for me. They do not give me new information. That is way I have shown the most common reversal patterns, which you should know.

Bullish Candles
HammerDragonfly dojiInverted HammerEngulfing(bull)Harami(bull)PiercingMorning StarMorning doji star


Bearish Candles
Hanging manGravestone DojiShooting starEngulfing(bear)Harami(bear)Dark Cloud CoverEvening StarEvening doji star


Other Candles
Long CandleSpining TopDoji


The candles give us information about a change in balance of power between the two camps – bulls and bears. The enemy camp sends message that they are ready to fight for a given price level.
Example Engulfing (bullish) - the market opens lower, but the bears can not pull the prices down. The bulls show up and drive the prices higher closing above the previous day close. Clear message we are ready to fight for this level.

You can see in the first two tables the most common bullish and bearish candlestick patterns. It is obvious what their meaning is.
I will comment the candles from the third table.

Long day – long candle without shadow or very small shadow. Depending on where it appears, it has different name and gives us different information.
- at the beginning of a move – the appearance of a long candle with high volume, after a divergence for example, means the market has taken decision for the direction. The long candle ignites the rally or the sell off.
- At the end of a move – when the trend is mature and the sentiment is extreme bullish or bearish. The appearance of a long candle with high volume in the direction of the trend usually marks the end of the trend. We have buying/selling climax – the last bull/bear has thrown the towel.
- After a pause or correction – the appearance of a long candle says the trend resumes.

Doji or Spinning top shows indecision among the traders about the direction of the market. More often this is a pause after a rally/sell off. You can see several candles with short bodies - temporary equilibrium between bulls and bears. But they can appear at tops too. Then you will see one of the star candle patterns. Examine the indicators in the concrete situation.

Two candles, which I have not met in the books (You will not see such candles on Dow Jones 30 index there is not gaps. Look at the ETFs)
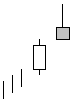
Black candle (the black candles above correspond to red candles) - in an up trend the market opens higher, but instead of a rally the traders use the rise to sell. The market closes above the previous day close.
Hollow candle – in a down trend the market opens lower, but instead of a sell off the traders use the moment to buy. The market closes bellow the previous day close.

My personal experience is that these candles have very high success rate. When you see them you must be with the finger on the trigger – expect change of the direction in the next one or two sessions.
The QQQQ chart bellow confirms what I have written. Look at the chart – after the appearance of a black or hollow candle short after that the direction changes. Of course you should examine the move in the context of the bigger trend.


---------------------------------------------------------------------------------------------------------------------------------------------------------------------------------------------------------------------------

Ако искате да научите повече за японски свещички ви препоръчвам книгата - “Japanese Candlestick Charting Techniques” от Steve Nison.
Можете да я намерите в интернет, или оставете съобщение с майл, ще ви я пратя.

Благодарение на StockCharts.com - ChartSchool
Въведение в японските свещички.
Бичи формации от свещички.
Мечи формации от свещички.
Каталог на по-важните формации.

Разглеждайки темата японски свещички, изхождам от позицията, че вече сте прочели книгите. Или поне това което съм оставил по-горе като линкове. Знаете повечето формации как изглеждат или поне най-важните. Няма смисъл да повтарям информация, която можете да намерите навсякъде в интернет.

Въпроса е как да ги използвате? Кои са силните страни на този метод? В повечето книги на това не се обръща внимание.

Важни неща за употребата на японски свещички
-Японските Свещички не са подходящи като самостоятелна система за търговия.
-Самостоятелно имат предсказваща сила 1 до 6 от следващите барове(свещички).
-Изчаквайте потвърждение – затваряне над или под формацията.
-Употребата им в комбинация с други методи ги прави изключително полезни и тук е тяхната сила.

Моя начин - „последния пирон в ковчега”:)
Какво имам предвид? Използвайки други методи очаквате някакво събитие - начало на корекция поради образуваща се дивергенция, сигнал по посока на тренда след корекция, достигната нива на подкрепа или съпротива и т.н. най-общо казано системата ви казва да очаквате промяна на посоката поради някаква причина.
Кога е точния момент за заемане на позиция? - Почти винаги момента е маркиран от обръщаща свещичка или формация.
Затова те са последния сигнал, който ни казва време е. Дават ни входната точка и нивото на стопа.
Агресивен подход (само по-посока на тренда) - при intraday пробив над/под формацията или единичната свещ.
Консервативен подход - изчакайте затваряне над/под формацията или единичната свещ като потвърждение.
Стоп – малко под най-ниската точка, съответно малко над най-високата точка на свещичката или формацията.

Тъй като използвам тренд следваща система, продължаващи формации не са интересни за нас, не ни носят нова информация. Затова съм показал най-често срещаните обръщащи формации, които трябва да знаете. За всички останали вижте дебелите книжки.

ВИЖТЕ ТАБЛИЧКИТЕ ПО-ГОРЕ

Свещичките ни носят информация за промяна в съотношението на силите между двата лагера - бикове и мечки. Противниковия лагер изпраща съобщение, че е готов да се бори за тези нива.
Например Engulfing(bull) - пазара отваря по-ниско, но вместо мечките да издърпат цените надолу, биковете се намесват и затварят над цените на затваряне от предния ден. Ясно съобщение ние сме тук и сме готови да заемем позиции.
Използвайте ги в комбинация с други методи, по този начин японските свещички се превръщат в много мощен инструмент.

Свещичките от първите две таблици е ясно какво съобщение ни пращат. Ще коментират другите които също носят интересна информация.

Long day - дълга плътна свещ без сянка или а много малка такава. В зависимост от това къде се появява има различно наименование и ни носи различна информация:
- в началото на движение - появата на дълга свещ придружена с голям обем след дивергенция например показва, че пазара е взел решение за посоката.
- в края на движение - когато трендът вече е "зрял", продължил е дълго и настроенията бичи или мечи са екстремни, се появява дълга свещ в посока на тренда придружена с голям обем и маркира края на тренда. Имаме bying/selling climax - и последния бик/мечка се е предал и затворил позициите си.
- след пауза(корекция) - появявата на дълга свещ маркира, възобновяване на движението по тренда.

Doji и Spining Top - показват равновесие между биковете и мечките, колебание сред трейдърите за посоката на пазара. По-често това е просто пауза след рали и виждате няколко свещички с тесни тела. Но също так е възможно и пазара да промени посоката си, при което ще видите една от формациите звезда показани по-горе. Всичко зависи от конкретната ситуация, в която се появяват.

Две свещички които не съм ги срещал в книгите (няма да ги видите при индексите наблюдавайте съответните ETFs - при DJ няма gaps)
Black Candle - черна свещ (черните свещи показани по-горе ги разглеждайте като червени:). Във възходящ тренд пазара отваря по-високо но вместо рали следват разпродажби и затваряне над цените на затваряне от предния ден.
Hollow Candle - куха свещ. В низходящ тренд пазара отваря по-ниско, но вместо разпродажби следва движение в обратната посока и затваряне под цените на затваряне от предния ден.

От личен опит съм забелязал, че имат много висок процент на успеваемост, и когато ги видите трябва да сте нащрек, за предстояща промяна на посоката - най-вероятно още следващата сесия.
Това се потвърждава и от графиката на QQQQ. Вижте как след появата им, малко след това следва промяна на посоката. Съответно трябва да разглеждате движението в контекста на по-големия тренд.

Elliott waves / Вълни на Елиът

Български по-долу

I am not a passionate follower of this method. Very often the count is visible when the move is over. The problem is that there is as many counts as Elliott wave followers. Every one has his count and when something does not work out the count is changed and whole picture changes. That is not my way to trade. That does not mean that Elliott waves a completely useless, but I prefer to use it only in combination with classical technical analysis, which has more weight when I make a decision.
P.S that has changed I think Elliott waves are great tool when you know how to use it. Do not forget to use it in combination with classical TA than you will never be caught on the wrong side:)

I will show some useful information about Elliott waves theory. The post should be more like reference to find fast basic information, and for details you should read some book about Elliott waves.
- For example „Elliott Waves Principle” by Robert Prechter.
- Short and informative tutorial - Elliott Wave Tutorial but you need registration(it is free).
- Very good video tutorial - Elliott Waves


Elliott waves theory - Introduction
One complete cycle consists of eight waves and has two distinct phases.
-The motive (impulsive) phase consists of five waves denoted by numbers 1-2-3-4-5. Three of these waves labeled 1, 3 and 5 are actually the directional move. They are separated by two counter trend waves labeled 2 and 4.
If you use technical analysis you will see rallies to the upper line of a trend channel and two counter trend moves, which find support at the lower line of a trend channel. The counter trend waves usually find support at EMA50 or support level, because they do not change the trend, the oscillators will reset from overbought state.

-The corrective phase consists of three waves denoted by letters a-b-c. The sequence a-b-c corrects the sequence 1-2-3-4-5. Corrections can have different form and they can be very complex – see the figure wave patterns. Usually they end at some Fibonacci level - 38.2%, 50%, 61.8%.
If you use technical analysis before the correction the trend-following indicators will show divergence between the highs which mark wave 3 and 5 and the oscillators will show lack of momentum - typical for wave 5. The trend-following indicators will reset and will be ready to rise again after the correction.

At the terminus of the eight-wave cycle begins a second similar cycle of five upward waves followed by three downward waves.

Wave patterns / Вълнови модели


Fibonacci
The Fibonacci sequence is derived of the sum of the previous two numbers and the first two are 0 and 1 - 0,1,1,2,3,5,8,13,21 and so on.
The ratios between two neighboring numbers in the sequence are 0.382, 0.618, 1, 1.382, and 1.618. For some reason these ratios are everywhere in the nature. You can find the same ratios in the market too. May be because we are part of the nature:)
It is worth to calculate the Fibonacci ratios which a targets for impulse or corrective waves. It does not cost you much time and very often the waves reach their target. Especially when they coincide with some other signal from the technical analysis – for example support/resistance level or divergence you should not ignore them.
I will show everything with figures, so you do not need to remember anything or to look for in the books.


Impulses
Impulses - basics
Impulses - Fibonacci ratios, Projections, Targets...
Impulses - spotting the end of a trend (wave 5)

Basic rules / Основни правила:
- Wave 3 is never the shortest wave. Usually wave 3 is the longest so called extended wave and wave 1 is equal to wave 5.
- Corrective wave 2 is deep and retraces 0,5 or 0,618 or 0,786 of wave 1, but it should never retrace 100% of wave 1.
- Corrective wave 4 is shallow 0,382 or 0,5 of wave 3 and it should not penetrate into the price territory of wave 1(exception diagonals).
- The maximum correction for wave 4 is usually in the range of the previous wave 4 of lesser degree (wave 4 of wave 3).

Classical impulse with most common ratios is shown bellow

And impulses which are a little bit different:
- Leading diagonal - usually appears as wave 1 or A. Wave structure 5-3-5-3-5 (wave 4 overlaps wave 1 - exception from the rule).
- Ending diagonal - usually appears as wave 5 or C. Wave structure 3-3-3-3-3 (wave 4 overlaps wave 1 - exception from the rule).
- Truncated wave 5 - the market is too weak and wave 5 ends bellow the high/above the low for wave 3.
- Extension - one of the motive waves 1,3,5 is much longer than the others. Usually wave 3 is the extended wave.


Fibonacci ratios for impulse waves / Съотношение при импулсни вълни
- wave 2 common retracement - 50% or 61,8% or 76,8%

- wave 3 is multiple of wave 1:
      -> wave 3 is not extended - 1.618x wave 1
      -> wave 3 extension - 2.618x wave 1 or 4.236x wave 1.

- wave 4 common retracement - 23,6% or 38,2% or 50%

- wave 5 is multiple of wave 1:
      -> wave 5 is not extended 0.618x wave 1 | 1x wave 1 | 0,618x wave 1 to 3
      -> wave 5 extension - 1x wave 1 to 3 | 1,618x wave 1 to 3.


Time dividers in impulse wave / Съотношение във времето при импулсна вълна


Corrective waves
Corrections - Introduction
Corrections - Fibonacci ratios

Corrections in contrast to impulses are very complicated, difficult to identify, they could take a lot of different forms, they are mutating all the time and you must adjust your count and if this is not enough a corrective structure could be a double or triple combination (see the first video above).

Here are the basic corrective waves:
- Flat - a flat is 3-3-5 wave sequence.There is different variations.... It could be:
-- regular flat(B is 90%-100%xA)
-- irregular(expanding) flat B is 1,236xA/1,382xA and C is 1,618xA or the low of the flat is (0,382xA added to the low of A)
-- running flat B>A and C finishes above the bottom of A
-- slanting-flat

- Zigzag - a zigzag is 5-3-5 wave sequence A-B-C (impulsive-corrective-impulsive). Usually wave A is not so scary and with wave C is coming the sharp sell off. C target 1xA or 1,618xA selten 0,618xA C is stronger.

- Triangle - a triangle is a 5 wave structure and each of this waves consists of 3 waves. Usually it appears as wave 4 or wave B. In a triangle each wave is shorter than the previous, in an expanding triangle each wave is longer than the previous one. The different type of triangles are - ascending,descending,symmetrical.

- Fibonacci ratios for corrective waves  /  Съотношения при корективни вълни


Corrections - alternation within impulses
If wave two of an impulse is a sharp correction, expect wave four to be a sideways correction, and vice versa.
Alternation(редуване) в импулсна вълна – вълни 2 и 4 се различават по вид – например 2 е зиг-заг а 4 триъгълник или комбинация.


Corrections - alternation within corrective waves
If a large correction begins with a flat a-b-c construction for wave A, expect a zigzag a-b-c formation for wave B (figure 1), and vice versa (figure 2).
Alternation(редуване) в корективна вълна - ако при по-голяма корекция А започне като "flat a-b-c", очаквайте "zigzag a-b-c" за В и обратното.


If a large correction begins with a simple a-b-c zigzag for wave A, wave B will stretch out into a more intricately subdivided a-b-c zigzag to achieve a type of alternation (figure 1). Sometimes wave C will be yet more complex (figure 2).
Ако голяма корекция започне с обикновен a-b-c зиг-заг за вълна А, вълна В ще се разтегне в по-сложен a-b-c зиг-заг, за да посигне редуване(фигура 1). По-някога С ще бъде дори по-сложна (фигура 2).


- Look for a cluster of signals-several ratios. I would say cluster technical analysis+Elliott waves
  Търсете клъстър от сигнали т.е няколко съотношения. Аз бих казал и клъстър TA+Elliott waves

---------------------------------------------------------------------------------------------------------------------------------------------------------------------------------------------------------------------------

Аз не съм много добър в прилагането теорията на Елиът, нито съм страстен привърженик на този метод. Проблема е, че колкото елиетисти имате, толкова и броенета имате. Ако нещо не става променяме,напасваме:) броенето, и картината се променя.
Това не значи че няма нищо полезно, което да използваме от Elliott waves, но аз предпочитам да използвам неща от този метод, които смятам че са полезни, в комбинация с класически технически анализ.

Тук ще покажа това което смятам, че може да ни свърши работа, а за подробности можете да прочетете някоя книга по въпроса.
Например „Elliott Waves Principle” от Robert Prechter.
Кратко и стегнато ръководство има тук Elliott Wave Tutorial, но трябва да се регистрирате (регистрацията е безплатна).
Видео курс - Elliott Waves


Elliott waves теория
Един пълен цикъл се състои от осем вълни и има две отделни фази
- Импулсна фаза съставена от пет под вълни отбелязани с 1-2-3-4-5. Имаме три вълни ралита по посока на тренда 1, 3 и 5. Те са разделени от две вълни обратни на насоченото движение - 2 и 4.
Технически анализ - ще видите ралита обикновено до горната част на тренд канал и две контра движения, които намират подкрепа в долната част на тренд канала. Тези контра движения най-вероятно ще завършат на ЕМА50 или ниво на подкрепа, защото не променят тренда, а осцилаторите ще се ресетнат от прекупено състояние.

- Корективна фаза състояща се от три вълни отеблязани с букви a-b-c. Тази последователност a-b-c коригира предходните пет вълни 1-2-3-4-5. Корекциите имат най-различна форма и могат да бъдат много сложни - вижте фигурата вълнови модели. Обикновено корекциите завършват на някое фибоначи ниво 38.2%, 50%, 61.8%.
Технически анализ – преди корекцията тренд следващите индикатори ще покажат дивергенция между върховете маркиращи вълна 3 и 5, а осцилаторите ще покажат липса на моментум въпреки покачването, което е типично за вълна 5. Тренд следващите индикатори ще се ресетнат и ще се подготвят за ново покачване след корекцията.

След приключването на цикъла от осем вълни започва втори подобен цикъл от пет вълни нагоре последвани от три вълни надолу.

Фибоначи
Редицата на Фибоначи се образува от сбора на предходните две числа като 0 и 1 са предварително зададени – 0,1,1,2,3,5,8,13,21 и т.н.
Основните съотношения между съседни числа в редицата са 0.382, 0.618, 1, 1.382, 1.618. Поради някаква причина тези съотношенията са навсякъде в природата. Можете да наблюдавате същите съотношения и на пазарите. Може би защото сме част от природата:) и всичко което ни заобикаля.
Струва си да пресметнете фибоначи нивата като цели за импулсни или корективни вълни. Няма да ви отнеме много време, а много често действат:). Особено когато съвпадат с някакъв друг сигнал от класическия технически анализ – например достигнато ниво на подкрепа/съпротива или дивергенция, ги взимам много на сериозно.
По-горе ще покажа всичко с картинки така, че няма да ви се налага да помните нещо или да ровите книгите.

Полезни неща:
- Максималната корекция за вълна 4 обикновено е в рамките на предишната вълна 4 от по-малък порядък (т.е. 4 от предната 3).
- При две съседни вълни тази по тренда е между 1,38 до 2 пъти по-дълга от предходната срещу тренда. Става въпрос за контра вълна в импулсна вълна, а не за корективни.
- На практика, от това което съм видял, Фибоначи нивата не трябва да се разглеждат като абсолютно точна стойност по-скоро като диапазон -> 33%-38% 49%-51% 61%-66%
- Ако осцилаторите показват липса на моментум, въпреки покачването на цените, най-вероятно движението е към края си и това е вълна 5.
- Трендследващите индикатори, като MACD например, образуват дивергенция между върховете маркиращи вълна 3 и 5. Очаквайте a-b-c корекция.

РАЗГЛЕДАЙТЕ ФИГУРИТЕ ПО-ГОРЕ