Apr 25, 2010

Weekly review / Седмичен преглед

I was expecting this week a pullback to begin.... it does not happen, it is not over until its over, right:). I was twice short on DAX shoring the rallies on the small charts, but i have closed the positions at ~6150-6160, because the prices do not want to break the support at ~6140. Nevertheless 100 points profit:) It is not bad playing against the market.

So where are we stand now? - all time frames signal UP, so we must look for long entries. The tricky part is - we are at rising resistance, very extended, very overbought. Every market breadth indicator is flashing warnings. Chasing such market is very dangerous.
For me the smart play now is to play long, but daily trades, do not expect another 1000 points on the Dow. This is my view for now until the market tell me something different.

Looking at the smaller charts, one hour and 15 minutes, I think the indexes have carved out some kind of 4-th wave shallow correction - sideway move on the DAX and a triangle on the Dow. That means we are in a 5-th wave now, but i do not expect it to last very long. Again play long, but daily trades.

And the charts:


DAX hvae broke the rising wedge and now we have a channel

Apr 18, 2010

Weekly review / Седмичен преглед

Hello traders!!!!
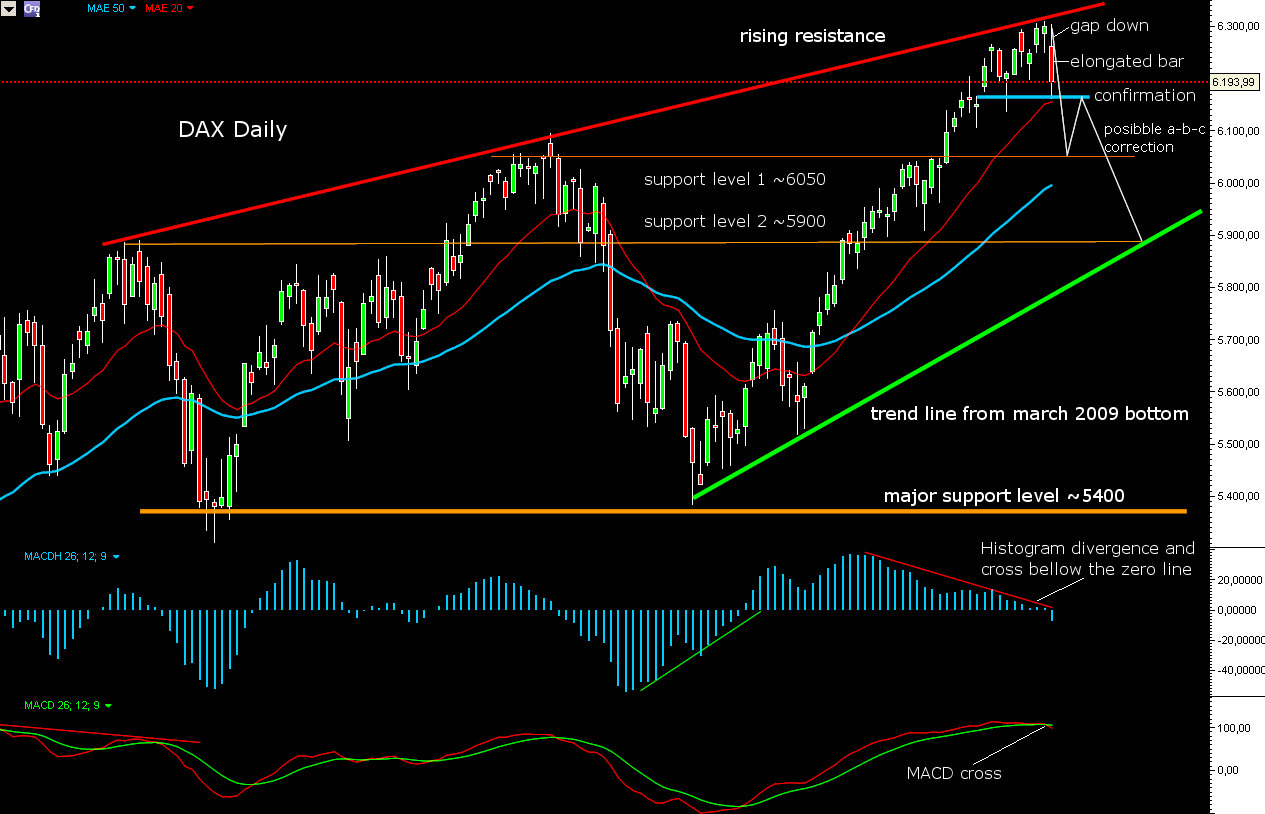
freeeeaky Friday ha:) I hope you have not been caught off guard. I have been expecting a pullback to begin for 2-3 weeks... and it has began on Friday.
Candlestick - DAX weekly hanging man followed from bearish engulfing, DJ weekly shooting star, DAX daily gap down followed from a long red bar, DJ daily evening star.
Long red bars with very high volume, bearish candlestick formations, market breadth indicators showing extreme bullishness - we have very high probability that a pullback has began.
But we still need confirming close bellow the candlestick formation, DJ should break the trend line on hourly chart and make lower low (DAX too). So the move is still not confirmed.

So short-term in the next two to four weeks into mid May, I expect a correction. The move should be just a pullback before we see higher prices July-August.

The big picture:
The bigger picture remains bullish so we should stay bullish and expect this down move to be just a pullback until the market tell us something different.
Long-term trend weekly charts - MACD is above the zero line the prices are above EMA50.
Intermediate-term trend daily charts - MACD is above the zero line the prices are above EMA50.
But be cautious if the move lasts longer then 2-3 weeks and is deeper than 3%-5%, we can see break of the trend lines on the daily charts and the divergences on the weekly playing out, which means at least intermediate-term correction for the whole move from the bottom March 2009.