Intermediate term view - when the current move is over we should see a serious correction like in 2011.
Another choppy week... the move lower still looks corrective, but we should see a move higher soon or this is not wave 4 of 5. The move is taking too long so I have changed the cycle count which in fact looks more bearish now and is aligns now with the EW count that a correction of a bigger degree is comming.
What we have now are market internals which are near to oversold levels and indicators reseting while the price is moving sideways....
Most of the time this is bullish, we have FOMC next week, the move lower looks corrective, the plan is working for months so far and I think one more push higher has the highest probability.
The problem is we have weekly bar closing bellow the previous two weeks with weekly MACD and RSI divergences, there is a way to count this move as finished, and it happens a correction to begin slowly reseting indicators and near to oversold levels to plunge into very oversold territory... so careful next week. I have not seen a top before FOMC so far but who knows.
Monday we should see SP500 start moving higher. If the top is in the choppy move should be some kind of a 1-2 1-2 and we should see gap lower and strong sell off. I will definitely take profits if SP500 open bellow 1980.
TECHNICAL PICTURE
Short term - this is how it should look like if one more push higher is left and the count is right. Divergences on the hourly chart, 38,2% Fibo for wave 4... it looks ok for one more push higher.

Intermediate term - if I am right after last final high we should see serious correction... but first a bounce from MA50.

Long term - no change. A bounce from MA50 and near the upper trend line with a lot of divergences... it looks dangerous.

MARKET BREADTH INDICATORS
The Market Breadth Indicators - we are seeing now divergences which were missing before. This is in sync with the EW count point to an important top. Short term we are near to oversold levels on Advance-Decline Issues and McClellan Oscillator and I expect a move higher.
McClellan Oscillator - nearing oversold levels and outside the BB. We should see a move higher.
McClellan Summation Index - sell signal with divergence.
Weekly Stochastic of the Summation Index - still a buy signal.
Bullish Percentage - divergence... sell signal... this time the rally is weak.
Percent of Stocks above MA50 - divergence at 55%... very weak internals.
Fear Indicator VIX - another indicator with divergence...
Advance-Decline Issues - not far from the oversold area...
HURST CYCLES
We either have the top for the current 40 day cycle behind us or we will see it very soon.

The move higher is taking tooooo long so I think we saw the 40 week cycle bottom at 1904 and the next one has begun. The first 20 week cycle was very short only 10 weeks, but it is what it is.
A move bellow 1904 will confirm that the current 40 week cycle and the 18 month cycle have toped out... The picture looks much more bearish now and supports the EW count calling for a serious correction.

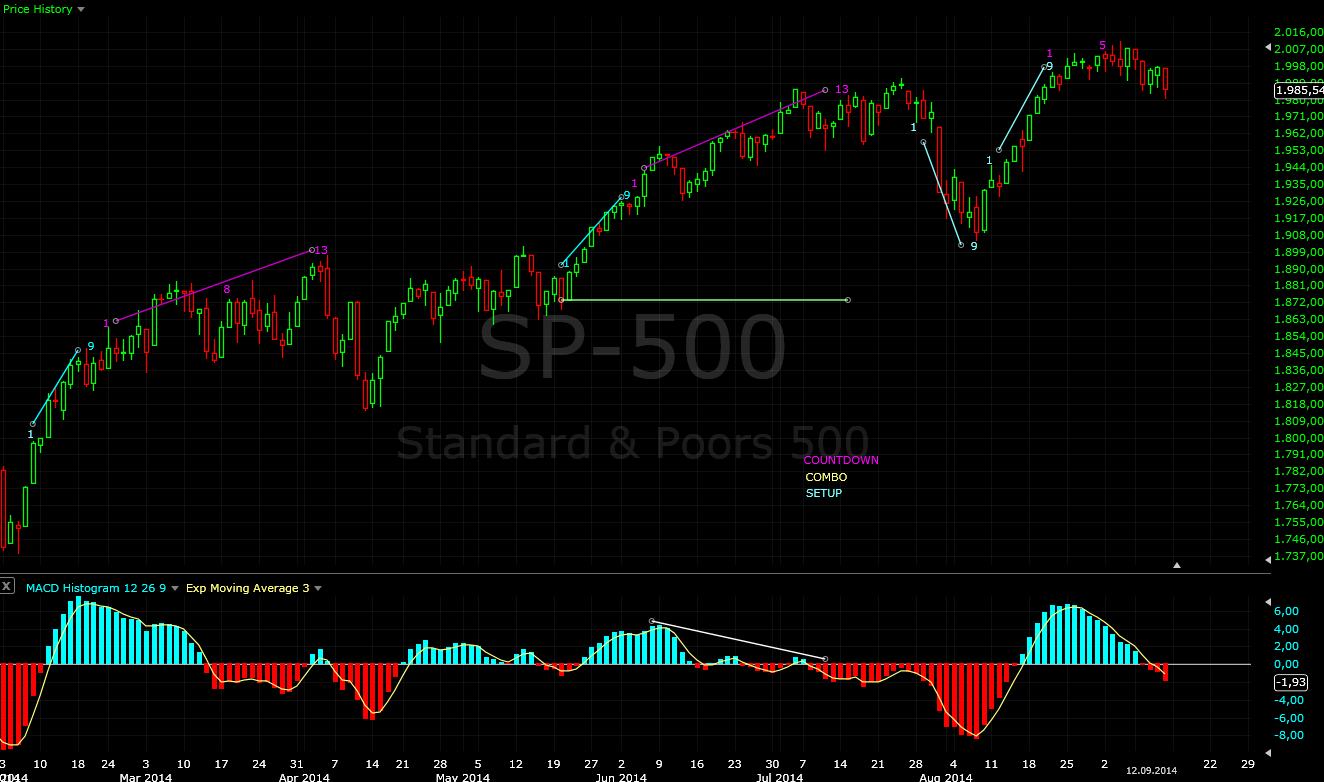
Tom Demark SEQUENTIAL AND COUNTDOWN - this technique spots areas of exhaustion.
Sell setup finished and countdown is running....
Countdown on the monthly chart finished. The price is crawling on the upper wedge trend line. If you exclude the shadows the wedge trend lines are converging together... and there is no more room for the price to move inside the wedge any more. Lets see in which direction it will break out:)

