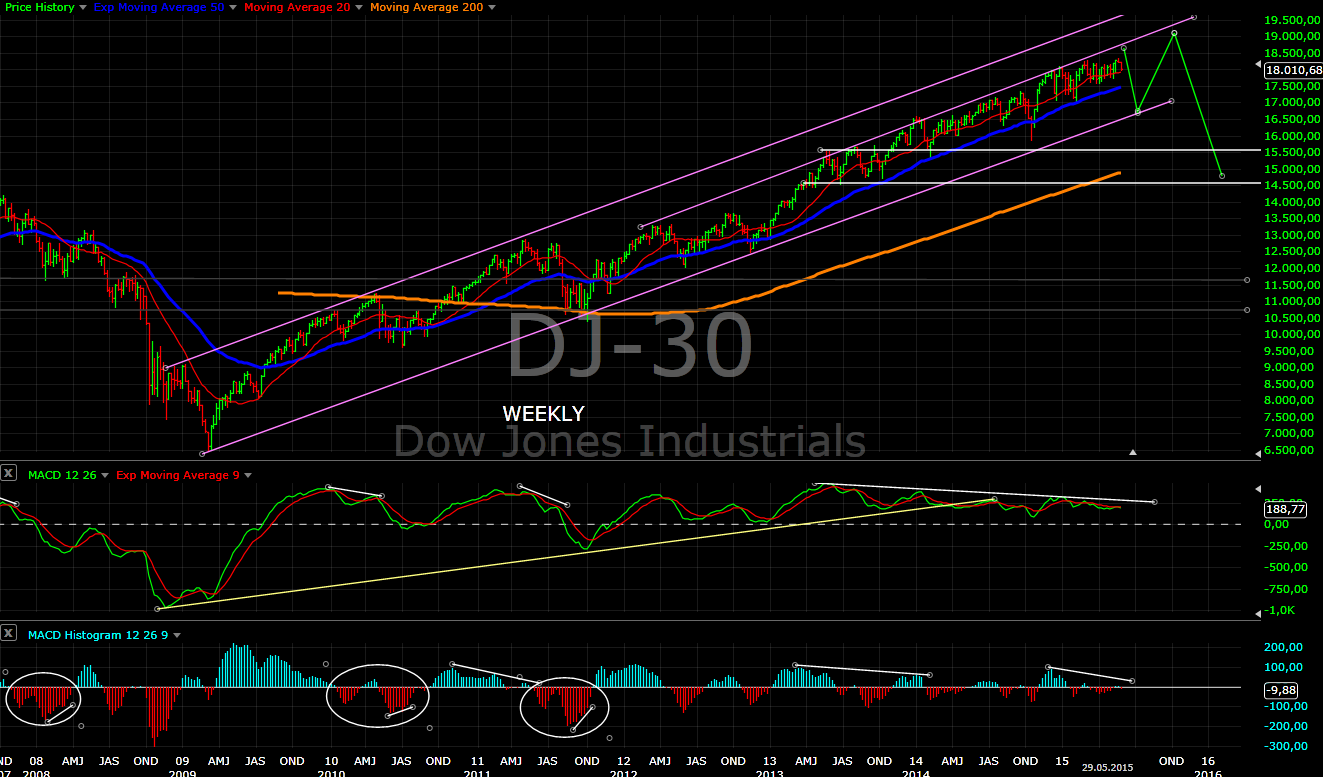
Intermediate term view - I am not convinced that this is the top of the wedge... I think we will see one more ATH in June
The indexes moved lower as expected and for now are following the road map which I have shown on Tuesday. We still have not reached the point to say for sure which scenario is playing out, but I think we will see one more high before a significant correction.
The "mess" is now running for six months. I have read about the NYSE margin debt this weekend. It shot up substantially higher in 2015 and the price moved nowhere. A lot of buying is met with selling. This means for me distribution. This fits with the pattern and my expectation for a significant correction.
Here are the data from NYSE... simple chart and if you want to read more.
TECHNICAL PICTURE
Short term - the support level 2120-2125 has been broken and tested. One more push lower to finish a corrective move will look great. The measurement points to 2090.
As long as the price stays below 2120-2125 the move is bearish. Move below 2080 will be very suspicious... that the red scenario is running.

Intermediate term - I think we will see one more high... now waiting to see how the move lower will look like.

Long term - no change
MARKET BREADTH INDICATORS
The Market Breadth Indicators - are bearish, but not bearish like important watch out... rather a correction is running.
McClellan Oscillator - bearish below zero.
McClellan Summation Index - sell signal.
Weekly Stochastic of the Summation Index - sell signal, but in oversold territory. The move is near it's end.
Bullish Percentage - sell signal but nothing really convincing.
Percent of Stocks above MA50 - in the middle of the range, a mess like the indexes.
Fear Indicator VIX - long term higher lows... wedging too.
Advance-Decline Issues - in the middle of the range.
HURST CYCLES
Day 44 and waiting for a low of the 40 day cycle in the next days.

A move lower for 1-2 weeks will look perfect to finish the 20 week and 40 week cycle.
P.S. probably I will have to change the count with the next low only as 40 week low and not 18 month low.

Tom Demark SEQUENTIAL AND COUNTDOWN - this technique spots areas of exhaustion.
Setup lower at 5 is running. On Monday closing 3-4 point lower and we will have 6 and higher probability the setup to be finished.

Every index has it's own version of the wedge which deviates a little bit. I think NYSE has the best shape compared to the other indexes where the ED is not so well visible.


