Short term - it looks like impulse, but something does not feel right. Now 2900-2920 is resistance zone. I see impulse testing it, next we should see zig-zag lower to confirm the indexes turned up and move above this resistance zone.

Intermediate term - choppy pattern again overlapping with previous highs, I am not 100% sure where wave b is, but in both cases it is pointing to the same outcome and pattern just the Fibo levels are slightly different.
If you measure the waves 3=1.236x1(both white and red) and 4=1,618x2(white) 4=1,236x2(red). The next high is expected the first week of June and the second 20 week cycle should rally at least weeks 3-4 before it fails(again first week of June). If you draw the trend line it will be hit the first week of June around 3030. If you measure 5=1.236x3=3030(white) 5=3~3040(red).
This is what I expect - 4 weeks higher 3030-3040 to finish ED.

Long term - one more leg lower to finish wave IV from 2009 - D for triangle(zig-zag decline) or B for a flat(sharp sell off as an impulse). Decline in three waves and a low in Q1.2020 will fit better with cycles. I do not know how to count an impulse, but if I am wrong it is wave 1/V.

MARKET BREADTH INDICATORS
Market Breadth Indicators - McClellan Oscillator almost a month below zero, VIX sharp up move to 24... usually this are signs that a bottom is close and not a decline just begun.
McClellan Oscillator - below zero for several weeks.
McClellan Summation Index - sell signal with divergence.
Weekly Stochastic of the Summation Index - sell signal.
Bullish Percentage - pointing lower and below 70.
Percent of Stocks above MA50 - pointing lower in the middle of the range.
Fear Indicator VIX - too high too quickly... not sure how to interpret it. Is the sharp rally caused because of the record short VIX positions and short squeeze or we have 20 week cycle low.... maybe both. I prefer to see it testing the low with divergence before the next sell off begins.
Advance-Decline Issues - in the middle of the range.
HURST CYCLES
The 20 week cycle took the last train:))) We are seeing the second daily cycle low and most likely 20 week cycle low. In theory both the daily and weekly cycle are strong right translated and we should see another higher high. This will not break the 40 week cycle high idea, it will come later in 3-4-5 weeks and it will be still in the average length.
The biggest problem I have with cycles is to find the 20 week low... sometimes the amplitude disappears and it is difficult to find the low. First you can count two daily cycles(not always clear) - check we have it, and second I use long moving average of the McClellan Oscillator - MA50 McClellan Oscillator. You can see around the red line we have 20 week cycle low and around the blue line we have 40 week cycle low. For example 2017 was very difficult year to find lows:) it is not clear where the 18 month low is and despite that this chart works great to show you where the 20/40 week lows are. So the current message is we have 20 week cycle low - McClellan Oscillator almost a month below zero causing the MA to print this low value despite the indexes rising higher. This is how it can find hidden lows. The previous two plunges begun from a high 10-15 where the tops are and not from a low as we are currently.
Day 43, probably a daily cycle low on Friday.
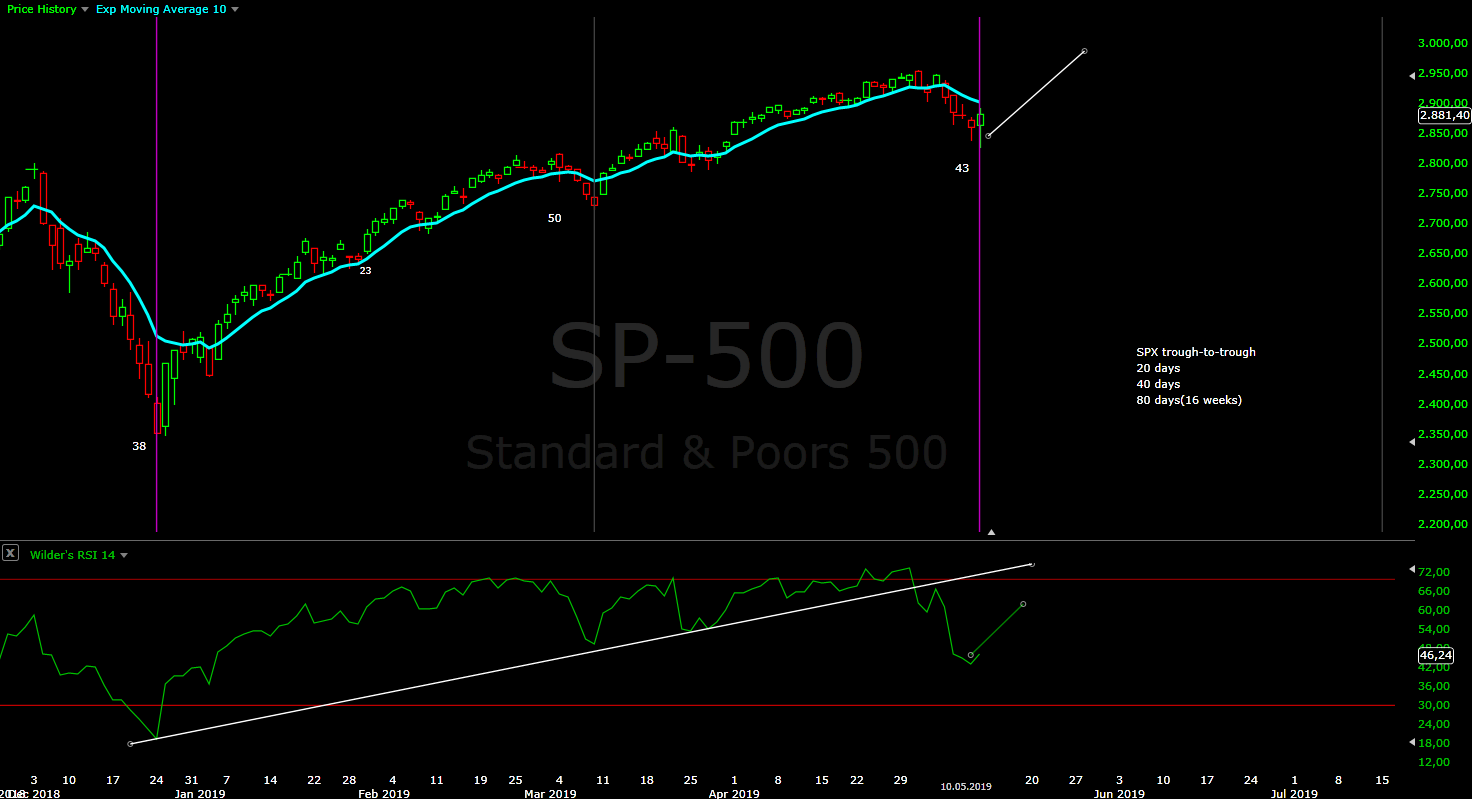
Week 20... it feels like 20 week cycle low.


