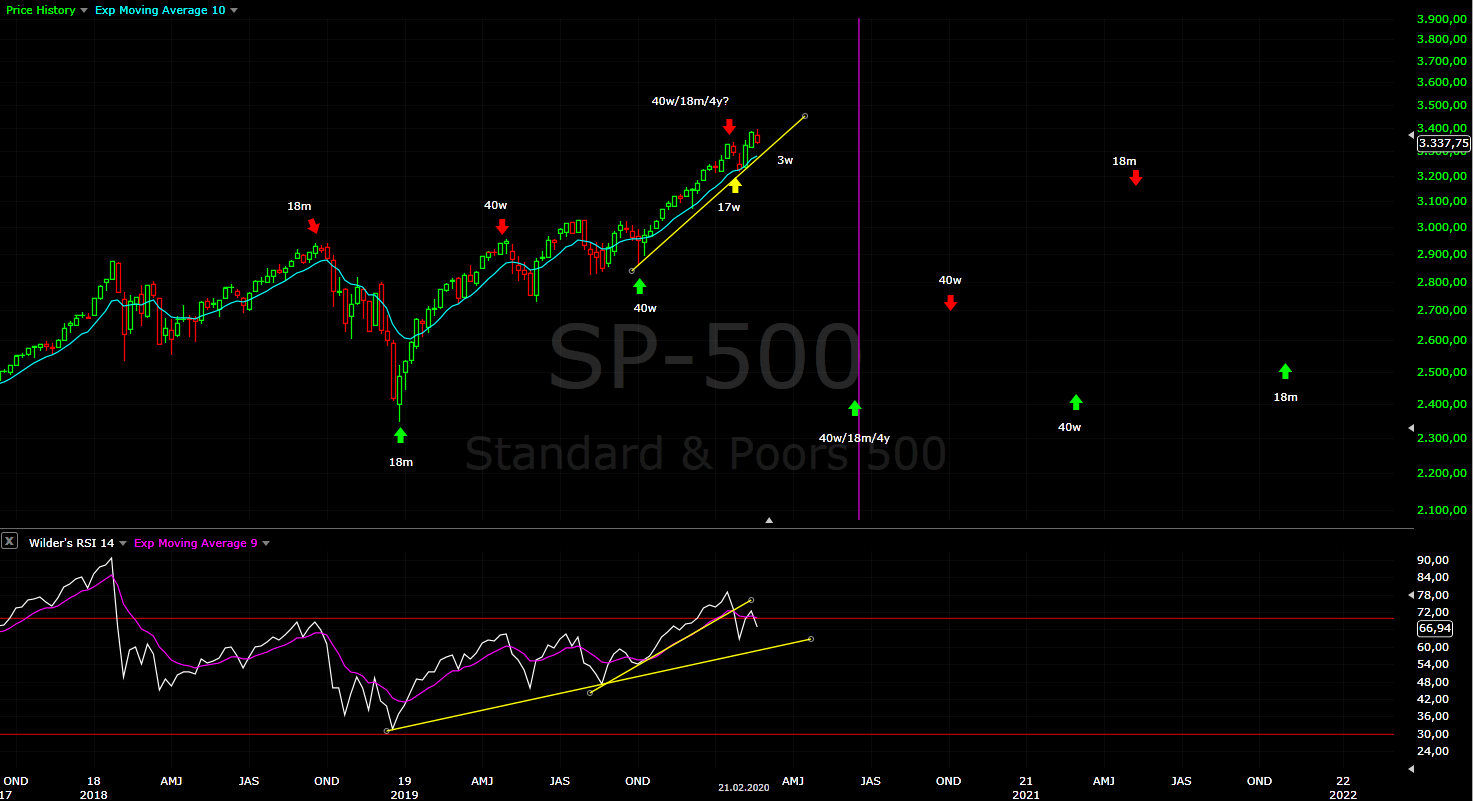
Short term - at first it looks like impulse, but I do not see such for the other indexes or the futures. I think it is a-b or some ED running. Again as long as it stays above 3300 we should see move higher, for something bearish we should see acceleration below that level.

NYSE again with more clear picture, many indexes have this zig-zag up/zig-zag down pattern. For a top I want to see NYSE making higher high to synchronize with DJ/SP500... it does not make sense if they have different patterns.

Intermediate term - the indicators do not look so good. Waiting for the move up to be completed after that expect MA200 to be tested.
In arithmetic scale after one more high we will have two legs up with roughly the same size.... zig-zag corrective pattern.
Below DJ and RUT how I see a complete pattern. It is the same for SP500 just this indexes show it more clear. The outcome for the both patterns is the same it is just the labeling and they will hit the high at the ideal cycle time for a top.

DJ with ED for c/y/B.

RUT with series of zig-zags including all four a and c waves.
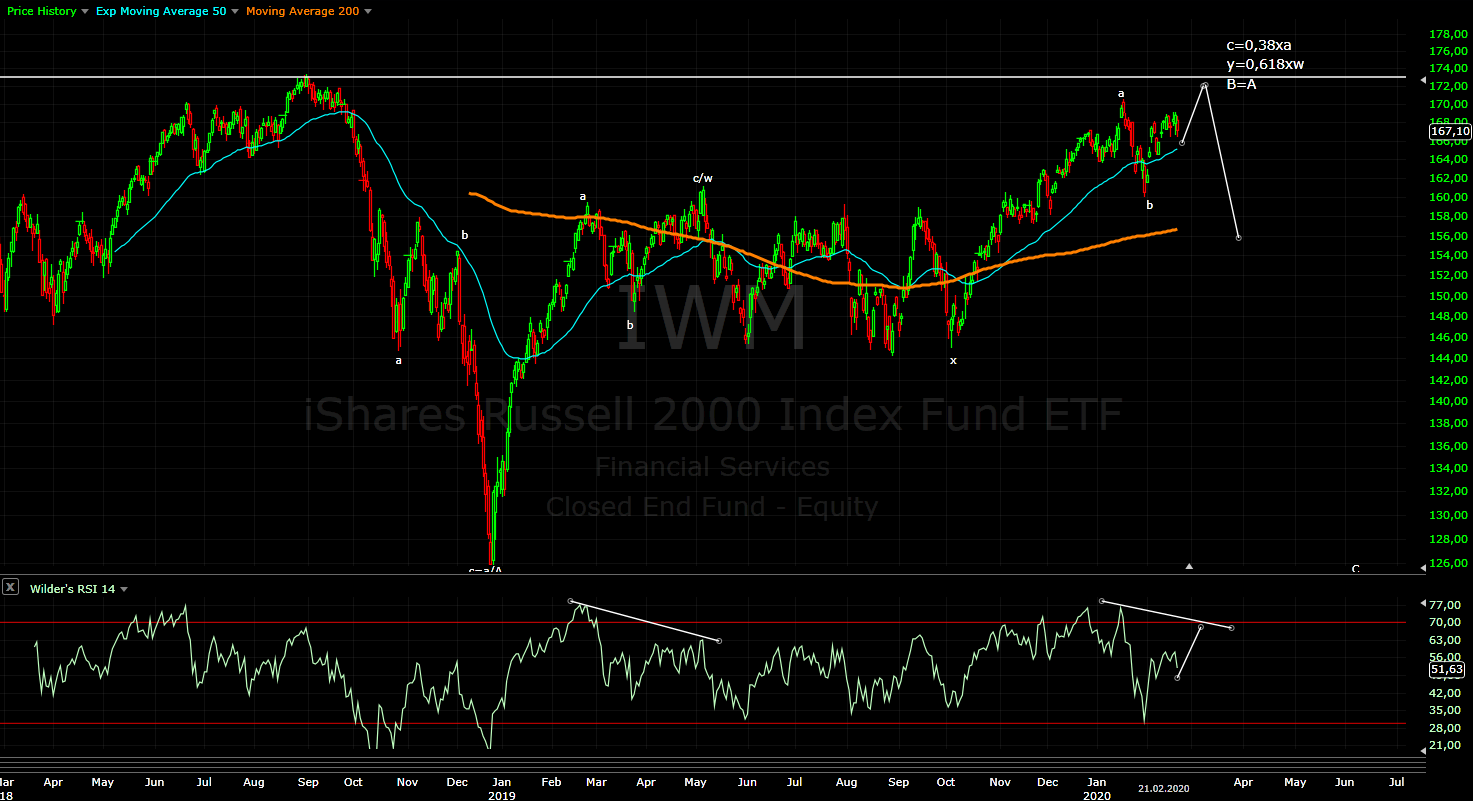
Long term - close to the top of wave B, once completed we should see sell off into the end of Q2.2020. It will complete the correction which begun in January 2018. Alternate scenario shorter impulse C for running flat, less likely zig-zag lower w2 for a big ED.

MARKET BREADTH INDICATORS
Market Breadth Indicators - the same weak with divergences, pointing lower and sell signals.
McClellan Oscillator - below zero, divergences.
McClellan Summation Index - sell signal with divergences.
Weekly Stochastic of the Summation Index - sell signal.
Bullish Percentage - divergence, turned lower.
Percent of Stocks above MA50 - below 75, pointing lower with divergence.
Fear Indicator VIX - series of higher lows, the next big move is spike higher most likely in March.
Advance-Decline Issues - turned lower with double divergence.
HURST CYCLES
Daily(trading) cycle - roughly 1/3 of the cycle. Sell signal was triggered - the price is below MA10, RSI below MA18, the price broke the trend line. As expected this cycle is weaker than the previous two.
At the moment I am ignoring the signal and giving preference to EW+cycles. I could be wrong, but I want to see either completed pattern or reversal pattern and there is no such at the moment.

Hurst cycles - the first two cycles look perfect 15 days high-to-high for the 20d cycle and lower, now we have day 15 low-to-low for possible 20d cycle low(not confirmed yet). Why is the first week of March interesting for a top:
From high-to-high perspective I am expecting to see 5w high before the markets turn lower. This is 2x20d cycles or the first week of March.
From low-to-low perspective we have new 20w cycle running so I think the minimum is one 20d cycle higher(check) then the second 20d cycle should "fail" and revers around the middle of the cycle or before that - another 6-8 trading days higher is again the first week of March.

Week 3 for the 20w cycle. Weaker as expected - DJ,NYSE,RUT are struggling below the previous high, SP500 around it. It is all about the tech stocks - many of them completing w3 from 2009 and many with vertical moves. We should see spectacular decline into the 4y cycle low because first it is compressed in time and second it follows vertical patterns.... and they always end the same way - vertically lower.