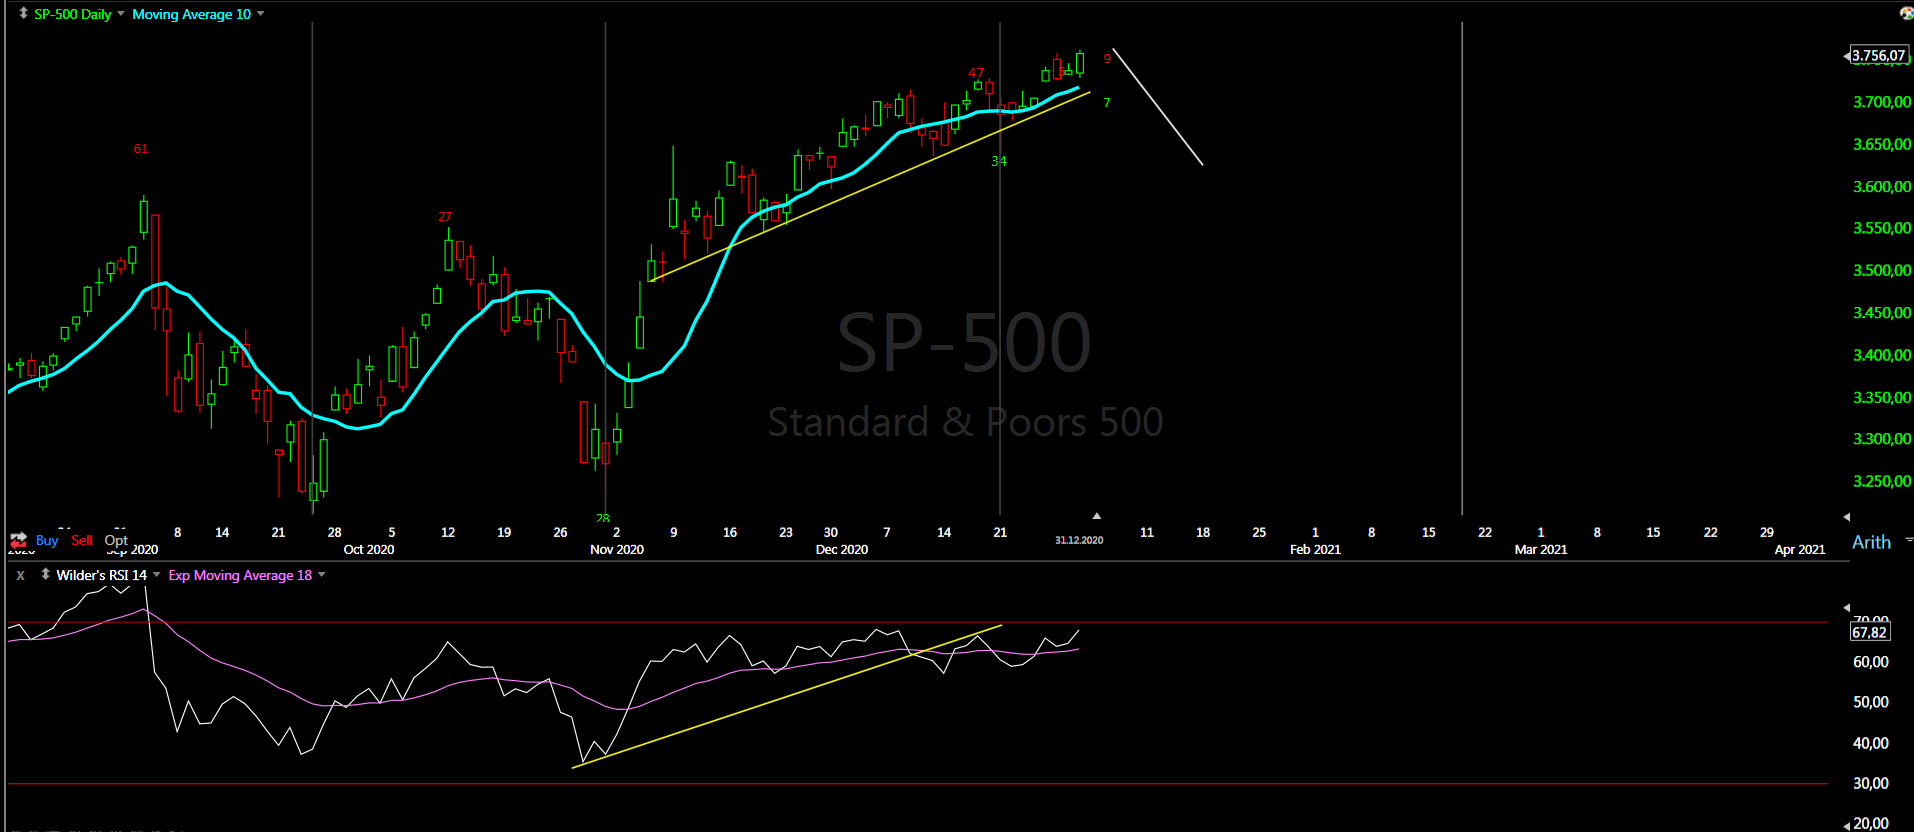
Nothing new to add - higher as expected, ideally we should see another 1-3 days for 20d cycle high and completion of the pattern.
P.S. long term update is posted below and there is a link in the first menu on the right side.
TRADING
Trading cycle - buy signal. I think it is dangerous to be long, because I expect the same cycle setup as Jan-Feb this year - double top and turn lower.
TECHNICAL PICTURE and ELLIOTT WAVES
Short term - I think we have diametric for the c-wave and the last wave itself is a diametric, which needs the final two waves to be completed Below 3690 means with high probability we saw the high for this c wave, confirmation is below 3640.
Intermediate term - nothing new, the indicators with long and short term divergences warning for a high. Neowave pattern symmetrical completing at 18m high looks good. Classical EW pattern should be W-X-Y with the catch that there is no impulses.
Alternate this is THE top. I do not believe it much, but if we see the last move retraced in less time like 3-4-5 weeks we have reversal.
Long term - the bull market completed in 2018. Since then a bunch of corrective waves. Currently I think this rally should be a corrective wave of a bigger pattern most likely triangle. Look at NDX we have corrective wave which is 1,618 bigger than the previous one which could be only b of a triangle. I think the best looking pattern is Neely's triangle.
Alternate pattern, which makes some sense and works with cycles, is mega expanded flat
MARKET BREADTH INDICATORS
Market Breadth Indicators - looking toppy with divergences, but still not serious turn lower.
McClellan Oscillator - around zero.
McClellan Summation Index - sell signal.
Weekly Stochastic of the Summation Index - sell signal.
Bullish Percentage - short term weakness with divergence, but still above 70.
Percent of Stocks above MA50 - something like double top?
Fear Indicator VIX - short term divergence.
Advance-Decline Issues - weak sligthly above zero.
HURST CYCLES
Short term cycles - expecting to see 20d high and turn lower, ideally something between 1-3 days.
It seems we have nice rounding top and it seems we have to dominant 20w cycle with bell shape. This is the reason why the shorter cycles 5w/10w are not well visible.
Week 9 for the 20w cycle. The indices are at 20w cycle high and turn into 20w low is around the corner.
Tom Demark SEQUENTIAL AND COUNTDOWN - this technique spots areas of exhaustion.
We have completed sell setup on the weekly chart. The previous two occasions marked intermediate term top for 20w and 40w cycle high.
Jan 3, 2021
Jan 1, 2021
Long term - update
Happy New Year!!!!
I wish you successful year and good luck trading in 2021.
Really crazy year... the lost decade I was talking about, it is playing out in the real life and the assets are just mirroring this craziness. The current system(social order, financial system, the life as we know it etc.) started to fall apart in 2000 and since 2018 we are watching the begging of the end. The normal has died, stupidity and dictatorship is on the rise. We are in transition phase and this is the new normal. It will get worse before it gets better - this is how usually it plays out.
This is exactly what my pattern and cycle analysis is showing - mirroring the emotions from the real life. I do not see how it is possible, in the beginning of the biggest mess in real life, to see some third wave or what ever fantasy most have...
George Carlin 10 years ago real prophet:) The first 30 seconds is all you need to know about this "scary virus".
The current view for the next 6 months, all assets should continue to move in sync:
- Stocks - the next six months should be very volatile - low in February -> important high late March/April -> important low in the summer.
- Bonds - should make a high in the next months and decline into 18m cycle low.
- USD - higher in the next 6 months.
- Precious metals/miners - probably hit already 9y cycle high, even so I expect test of the high and then bigger decline in sync with the indices.
- Crude Oil - the same like the indices 18m high expected in a few months followed by decline into 18m low.
- STOCKS
Another corrective wave from the low in March 2020 is running. The pattern should be completed at the 18m cycle high in April. After that we should see decline into 18m low. There is an option that this is the price high, but I still think the pattern high should be in April.
For now expectibg lower low c wave of expanding triangle, alternate pattern, which makes some sense and works with cycles, is mega expanded flat
Long term I expect 4y cycle high in 2022 so the bigger decline is expected in 2023 and later. Neely`s triangle is the best looking pattern so far.
- BONDS
Decline into 40w cycle in November was expected - we saw it. Now we should move up into 18m high followed by a decline for 18m cycle low.
- FOREX
I was not sure what exactly is going on in the FOREX world, I think some big sideways pattern is running probably triangle, which will take a few more years and complete with 18y cycle low in 2023 for the USD .
Below how I see the big picture - 18y cycle highs and lows, which are running roughly 16 years long.
USD hit 18y cycle high in Dec.2016 and now it is heading into 18y cycle low sometimes in 2023.
The pattern is clear corrective sideways move, there is no reversal.
For the next 6 months the USD should move higher probably d-wave of a triangle.
USD/JPY really ugly pattern... I would say 4y cycle low and the pattern best guess triangle in a triangle.
- GOLD/SILVER/MINERS
The precious metals sector is heading into important 9y cycle high. The question is do we saw the high or it will occur in a few months in sync with the indices. The second option looks better, but this down phase is lasting very long.... maybe double top.
Gold - either hit 9y cycle high, alternate we will see the high in a few months. Anyway I expect test of the high or marginal higher high in a few months followed by turn lower into 9y cycle low.
Silver - the same but showing the lows, 4y low in March and now heading or hit 9y cycle high. Intermediate term we have 40w low early December and after a high in a few months decline into 18m low should begin.
Miners - the same like precious metals 4y low and now hit or heading into 4y/9y high. Intermediate term - 40w low, in the next months we should see test of the high and decline into 18m low.
- CRUDE OIL
Nothing much to say - I see the same pattern and cycles like the indices. In a few months we should see 18m high followed by decline into 18m cycle low. The pattern is corrective zig-zag.
Subscribe to:
Posts (Atom)