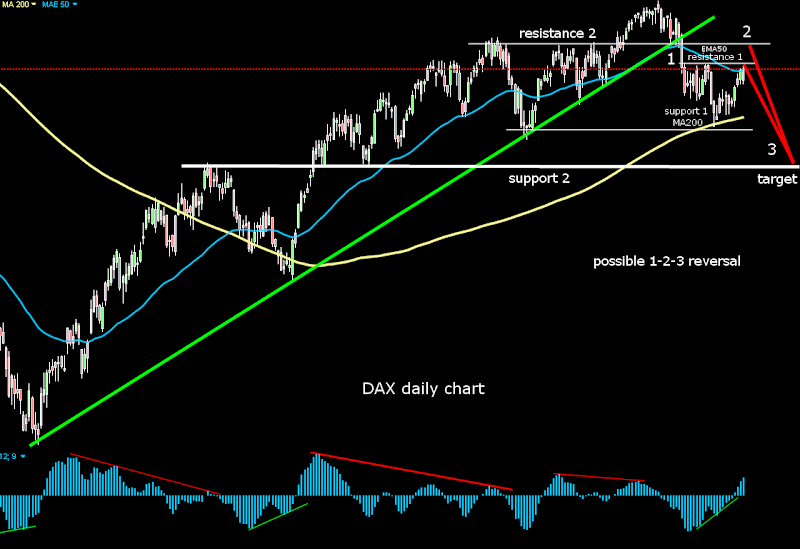
The intermediate-term signals are mixed. The picture is not clear if we will see a-b-c correction or something else.
On weekly chart MACD is bellow its signal line, the prices are bellow MA20, there is double cross for the first time since March.
On daily chart is MACD bellow zero and we have triple cross EMA10 and EMA20 are bellow EMA50 which is bearish.
On the other side - the histogram on weekly chart has made higher bar and MACD have a bullish cross on daily chart.
The prices have bounced of MA200 on daily chart and EMA50 on weekly chart.
In fact the prices are trapped between MA20 and EMA50 on weekly chart and MA50 and MA200 on daily.
The intermediate-term is not clear, so lets leave the bulls and the bears fight for the direction of the market.
Until then I will concentrate on the short-term to see if we can make some profit:)
The short term trend is still UP for the moment.
MACD bullish cross above the signal line, the histogram is rising. The prices are for three days above MA20, but bellow MA50.
On the hourly chart we have a bullish triple cross and MACD is above zero.
BUT short-term I expect another leg down after this rally is over sometimes next week.
On the move down we have had very high volume, we saw distribution and now the rally is on light volume which is declining.
DAX have stopped at resistance EMAs and DJ is testing the broken trend line.
On the hourly chart DJ have a rising wedge and DAX MACD divergence.
We have three wave corrective move hitting 50%(DAX) and 61,8%(SP500) Fibonacci level.
The behavior of the prices and the histogram tells me that this is a corrective move - intuition:).
See the charts bellow.
So if i am right the next week we will see 2-3 days choppy sideway move before the next leg down begin.
The histogram on daily chart and the hourly charts will tell us when the moment has come.
BE DISCIPLINED there is not short signal yet, wait for the histogram to give you a signal and for a candlestick formation. There is always possibility that the markets move higher to resistance 2(see DAX daily) or for a double top for example.
My view - take profits if you are long, and wait for short signal.


 I expect 1-2-3 reversal watch next week the prices to turn down at resistance level 1 or 2 and MACD at the zero line.

No comments:
Post a Comment