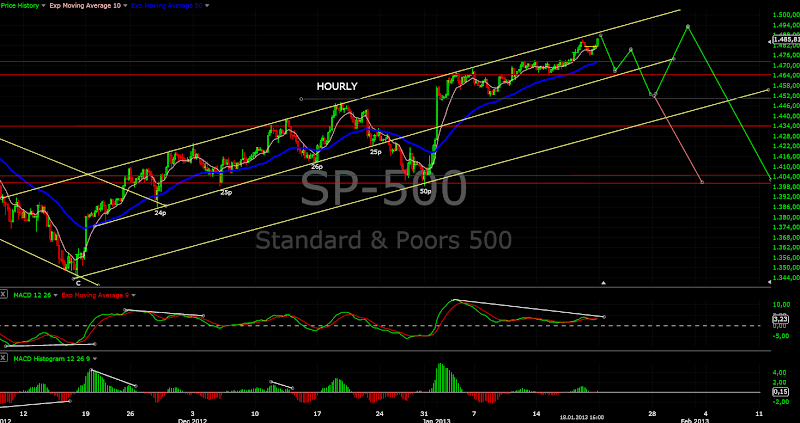
Short term view - when this spike up is over a pullback should begin.
Intermediate term view - I think the first pullback will be bought and after that we will see an intermediate term top.
I think the final move before a pullback has begun. Last week I have said to expect a spike - here it is. Probably the upper trend line will be breached and we will see ~1495.
I have been asked what I think about Russell 2000... I watched the charts a lot and what I see is bullish and I think the major indexes like SP500 have similar pattern. So my primary scenario now is a normal correction 5%-7%(that is around 1400 for the SP500) into early March and another move higher. The charts are updated and I have removed all counts because they only distract from the real action. There is at least five different counts which can fit but at the end the direction is up and I think we are in the final move up which will last at least until June-July before the topping process begins. For the short term there is two slight variations of the primary scenario. My preferred one is a pullback and last final move up before a correction for several weeks.
TECHNICAL PICTURE
Short term - the two variations are shown on the chart. There is divergence on the MACD on the hourly chart and on the histogram on the daily chart so waiting for the pullback... support,MA20 on the daily chart,25 points reaction like the previous ones - all that points to 1450-1460 as a target.
Intermediate term - the chart looks changed a lot but in fact is the same compared to the one posted on Wednesday. I have removed the counts, added the wedge trend lines and flipped the scenarios primary<->alternate. So I am watching the light green lines - pullback->test of the upper wedge trend line->correction 5%-7% and test of the lower wedge trend line. Only if the price breaks convincingly bellow 1400 something more bearish is going on.
Long term - this is the big picture. I think we are in the middle of the move up. For the fans of Elliot waves A-B-C->W / A-B-C flat->X and now near the end of A of Y.
MARKET BREADTH INDICATORS
The Market Breadth Indicators are in overbought territory but bullish. There is no any bearish signs, I see strength and that is not what you see at meaningful Tops. That is another sign to expect only correction to relief overbought conditions.
McClellan Oscillator - more and more divergences, a warning that we are nearing a top for this move.
McClellan Summation Index - bullish moving up
Weekly Stochastic of the Summation Index - says that this swing is mature... but no sell signal for now.
Bullish Percentage - bullish on buy...
Percent of Stocks above MA50 - very high at 90. At this levels is a move usually exhausted.
Fear Indicator VXO - making record lows around 12... complacency is very high.
Advancing issues volume - the same like last week, the indexes are advancing but the volume is shrinking, we see lower highs.
Declining issues volume - the same picture, the indexes are moving up but the volume on the downside is expanding, we see higher lows.
HURST CYCLES
14 days of 20 day cycle we are nearing a short term top but not there yet.
9 weeks of 20 week cycle
The interesting part is that every rally is getting shorter and shorter... and the time between the tops is Fibonacci 0,618:) 43x0,618=27 27x0,681=15 15x0,618=9 lets see if this time the magic works:)
Tom Demark SEQUENTIAL AND COUNTDOWN - this technique spots areas of exhaustion.
Countdown 13 finished and at 7 of a setup. I think we will see Sequential reinforcement 9-13-9 sequence before a top.
Currently at week 12 of countdown and combo. If SP500 records a higher prices next week the counts will be finished. Look at the chart - every time when a setup/countdown/combo is finished there is a pullback or correction. I do not think that this time will be different.
Subscribe to:
Post Comments (Atom)


Thanks!!!
ReplyDeleteI am glad to hear that. I have put a lot of effort into trying to read the market correct and unbiased.
and I am happy that another people find it helpful:)