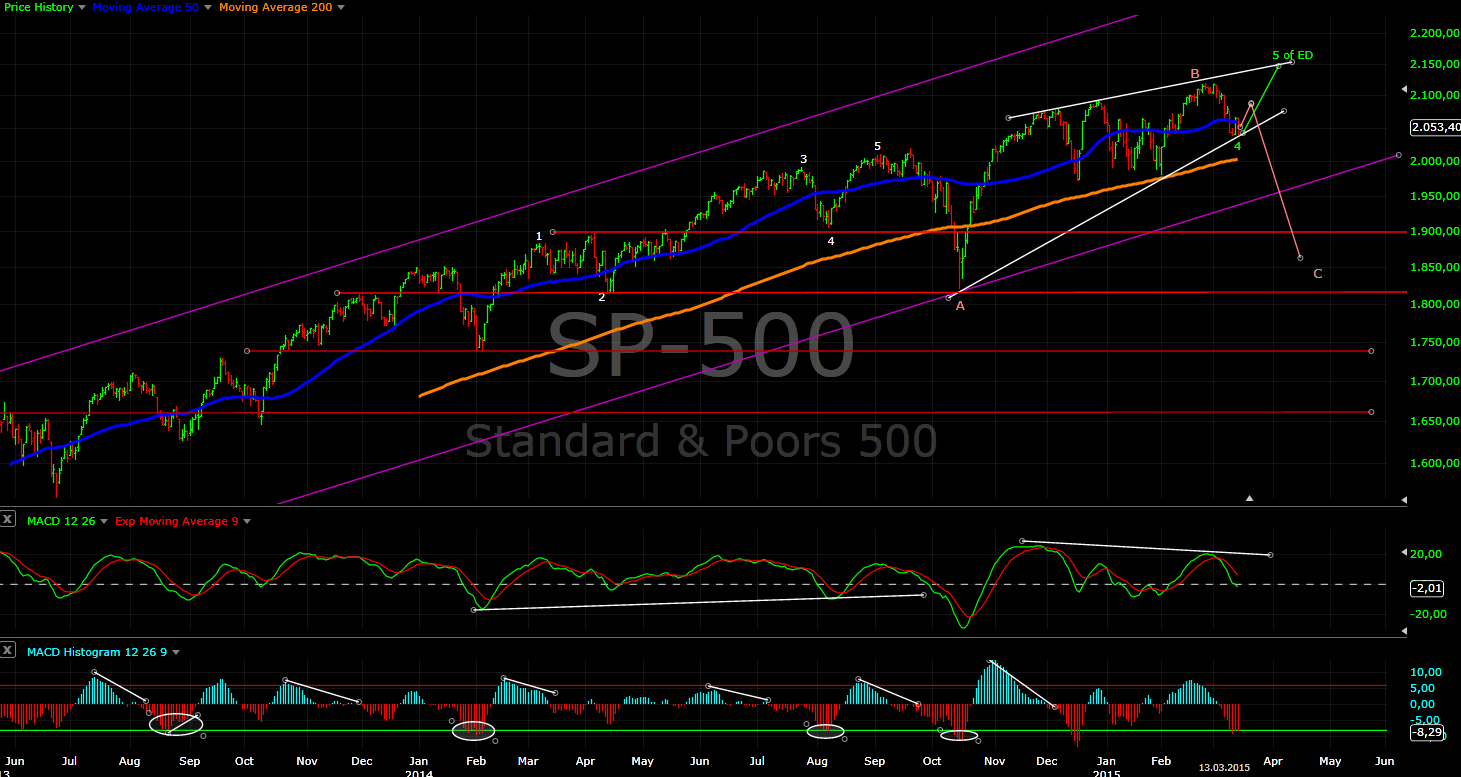
Intermediate term view - I think the correction is already running
SP500 moved lower to the 2040 area, but the move is weaker than expected. Both scenarios are still possible and we need a confirmation before excluding one of them.
The first one ending diagonal - I want to see a strong move higher in the next days before FOMC and retracing at least 50%.
The second scenario the correction has begun and this is the first leg lower - I want to see lower low and bottoming before FOMC.
Now I think that the correction has higher probability - the indexes were weaker than expected and the move lower starts looking more like an impulse,TomDemark setup lower finished another sign that the move lower has legs, Market breadth is pointing that we are in the middle of a correction rather than a bottom, the same story with cycles. I will just wait to see what happens next week.
This week it was all about the USD and FOMC. Everybody front running the FED which caused another sharp move higher for the USD. The macro data are worsening and with the parabolic move in the USD I expect only bla bla from FED trying to postpone rate hikes. This should cause a move into the opposite direction for EUSUSD.
The USD reached my target and I am curios if we will see a major bottom or only a corrective move. If you ask me parabolic moves always end the same way - collapsing. The parabolic move in the USD caused parabolic move in the DAX moving completely out of sync compared to US indexes. Watching the charts I think I should change the degree of my EW and cycle counts. I expect the DAX and US to synchronize again - wave 4 for the DAX and correction in the US. The intermediate term has not change, but the current correction and the subsequent move higher should be from a lower degree.
This changes the long term picture - I expect normal correction 7%-10% April-May -> new highs September-October -> important top and 15%-20% correction.
TECHNICAL PICTURE
Short term - the next days the price should hint us what is going on.

Intermediate term - now waiting to see which is it. As I said I think it will be the red one... but I like to see a confirmation. It is not the time to go short anyway.
Long term - I have adjusted the sizes of the moves because I think the long term has changed.

MARKET BREADTH INDICATORS
The Market Breadth Indicators - look like we are in the middle of a correction.
McClellan Oscillator - making higher low... short term bottom
McClellan Summation Index - sell signal
Weekly Stochastic of the Summation Index - sell signal
Bullish Percentage - sell signal, but still at high level.
Percent of Stocks above MA50 - in the middle of the range.
Fear Indicator VIX - another higher low
Advance-Decline Issues - moving lower...
HURST CYCLES
Day 29..... either another two weeks to finish 40 day cycle or short 40 day cycle(29-30 days) and higher high for 5 of the ED which will be the high of the next 40 day cycle.

Week 6... I am waiting to see how the low of this cycle will look like. It is possible that it is of a lower degree.

Tom Demark SEQUENTIAL AND COUNTDOWN - this technique spots areas of exhaustion.
Setup lower has been finished. The move lower has shown strength. The last time we saw a setup lower was Sptember-Oktober 2014 and 200points/10% correction has followed.

Thank u so much krasi.Gbu
ReplyDelete