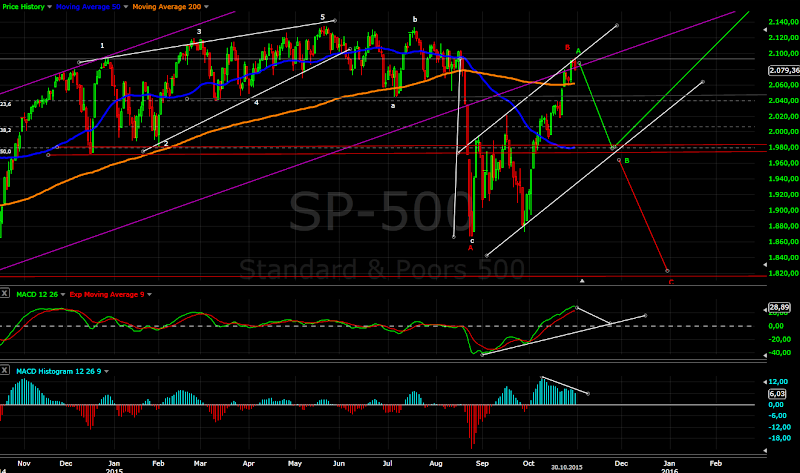
Short term view - the indexes should start moving lower.
Intermediate term view - correction for 3-4 weeks.
Ok FOMC is behind us, we have the last missing squiggles higher 4 points for the week.... now the indexes should move lower.
Intermediate term - the move since the August low printed 10 weeks higher so far which is a bullish 20 week cycle and after a correction we should see more to the upside. See the third chart too - history and cycles hint a continuation higher.
Short term - we have two waves higher with ratio between the waves 1,618. The question - is this wave 3 or C? Tom Demark setup was negated twice(last chart) and I expect the third setup to fail too so this is rather wave C than 3.
So the path with the highest probability for me is correction in November followed by one more leg higher. For the long term this translates into wave B of an expanded flat (see previous post cycles).
TECHNICAL PICTURE
Short term - now the move looks finished... as I wrote I think it is C, but we will have the diagonal on the radar.
Intermediate term - a correction should be scary. Perfect target will be test of MA50/support around 1980/Fibo 50% retracement/the trend line all this around the end of November.
Alternate scenarios if I am wrong is if we see an impulse probably LD or the bearish scenario(red) and this is wave B of a zig-zag.
Long term - given the deep retracement of the the current wave the more probable scenario is flat namely expanded flat with new ATH. For a triangle we need a much deeper correction in November to test MA200 one more time.
If we continue to compare with 2010/2011 we will see that a strong surge was followed by a 3-4 weeks sharp correction. In 2011 it was even at the same time of the year - strong move higher in October and 4 weeks correction in November.
MARKET BREADTH INDICATORS
The Market Breadth Indicators - there is no strong signals for a top but a few red flags - probably a move in the opposite direction.
McClellan Oscillator - red flag - multiple divergences does not support the move higher.
McClellan Summation Index - buy signal.
Weekly Stochastic of the Summation Index - red flag - buy signal, but reached overbought levels. The current move should be finishing.
Bullish Percentage - buy signal.
Percent of Stocks above MA50 - buy signal.
Fear Indicator VIX - close to a level which is usually a bottom.
Advance-Decline Issues - red flag - moving lower for most of October. Obviously the rally is not broad based and a few stocks are dragging the market higher.
HURST CYCLES
I think we have one shorter 40 day cycle and the next is already running at day 24. A correction for 3-4 weeks and it will be perfect.
I sticked to my cycle count and it looks that it works very good so far. In this case the last 18 month cycle lasted 81 weeks which is longer than the average length 65-66 weeks. Usually a longer cycles is followed by a shorter one and in the end you have average length again.
This means the 20 week cycles should be shorter or have average length. We are currently at week 10 and average length is 14-16 weeks which makes me think that a correction for 3-4 weeks in November will be the low of the current 20 week cycle.
Tom Demark SEQUENTIAL AND COUNTDOWN - this technique spots areas of exhaustion.
The third setup is running. If we do not see a new high on Tuesday it will be negated too. I am skeptical that it will be finished and I think this is a sign that we do not have a trend.
Subscribe to:
Post Comments (Atom)


nice information thanks for sharing valuable content with us we also provide great information related to your blog feel free to visit our Forex trading strategies
ReplyDeletenice information thanks for sharing valuable content with us we also provide great information related to your blog feel free to visit our
ReplyDeleteSensex.