Intermediate term view - another week or two higher than lower.
The pullback began promising the leg lower was looking like impulse and than another move higher instead of a second leg to finish a pullback. I would not say it is bullish behavior not letting the market to correct.
I do not know what this messy pattern is. It is corrective so forget about bear market, but I do not think this is wave 3 either. For me the charts does not look right for a buy signal and long lasting rally. This rally will fail - risking to be wrong and miss the beginning of wave 3 so be it.
TECHNICAL PICTURE and ELLIOTT WAVES
Short term - no clue what the pattern is. We will know in hindsight, which means with very high probability it is corrective pattern.

Intermediate term - will the price go vertically higher or test the trend line and ATH one more time before the second part of the correction begins? I think it is the second. If you are a bull pray for the second. Markets moving vertically are not sustainable and exhaust too fast.

Long term - the same story... will the indicators correct or move vertically higher?

MARKET BREADTH INDICATORS
The Market Breadth Indicators - I do not see any signs for important low just short term bottom. I think we will see the indexes crawling higher for another 1-2 weeks and market breadth building divergences.
McClellan Oscillator - spending time above zero.
McClellan Summation Index - buy signal level around 900... and where will wave 3 end if it has just begun at 3000????
Weekly Stochastic of the Summation Index - buy signal in he middle of the range.
Bullish Percentage - buy signal.
Percent of Stocks above MA50 - close to the upper level 75.
Fear Indicator VIX - at 13 complacency levels again.
Advance-Decline Issues - making lower highs.
HURST CYCLES
Day 8 of the 40 day cycle.

Week 2 of the current 20 week cycle.

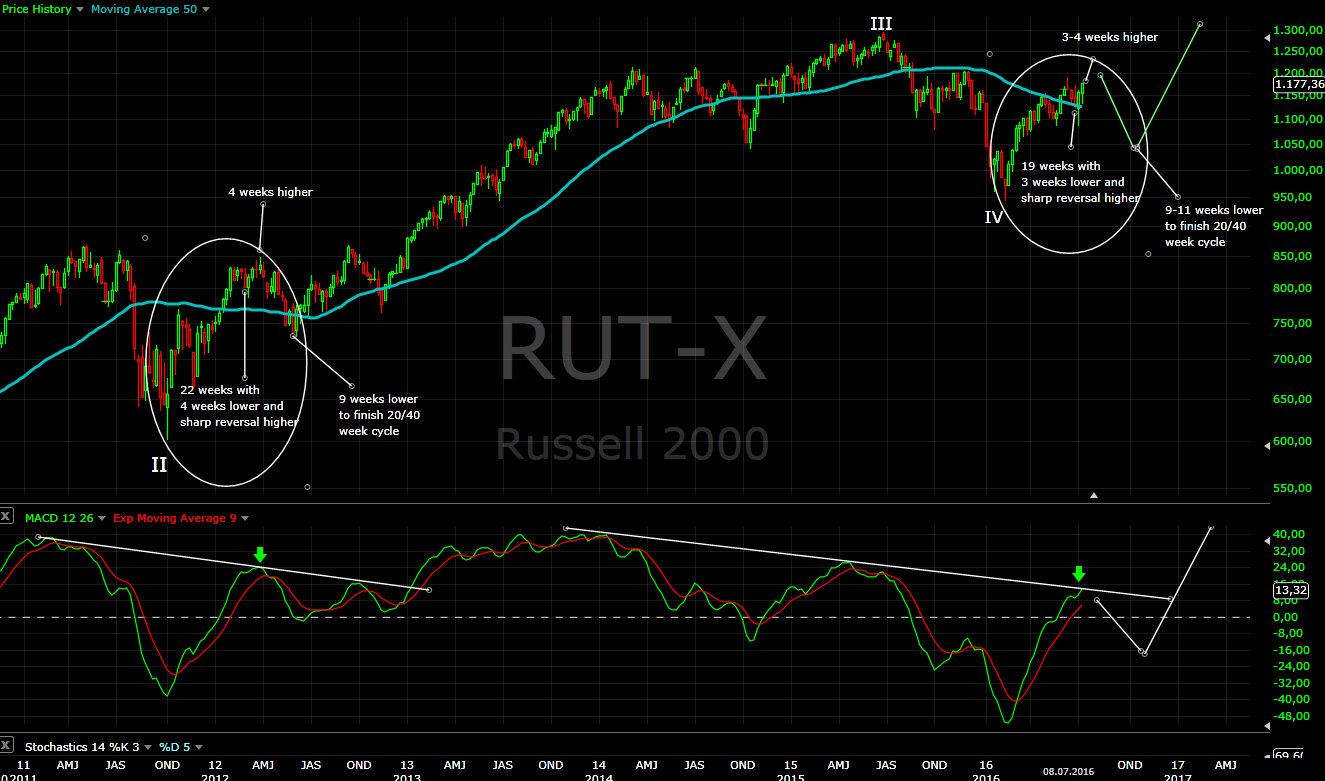
This is what I think is going on. This is comparison between wave III and V - how they are moving after the end of wave II and IV.
Wave III - 22 weeks cycle with 4 weeks lower. The next cycle began with sharp reversal and moved 4 weeks higher before turning lower for 9 weeks.
Wave V - 19 weeks cycle with 3 weeks lower. The next cycle began with sharp reversal and 2 weeks higher so far.
I think we will see another week or two before this rally is over and a decline for 2-3 months to finish 40 week cycle.
Hi Krasi, Thanks for your regular updates. These are really helpful. What is your view on USD and gold following recent rally in bullions?
ReplyDeleteThanks
Long term update is coming in a few days.
DeleteUSD should consolidate another 6 months, precious metals need some time (probably a few weeks) to finish their move higher and than correction is expected.