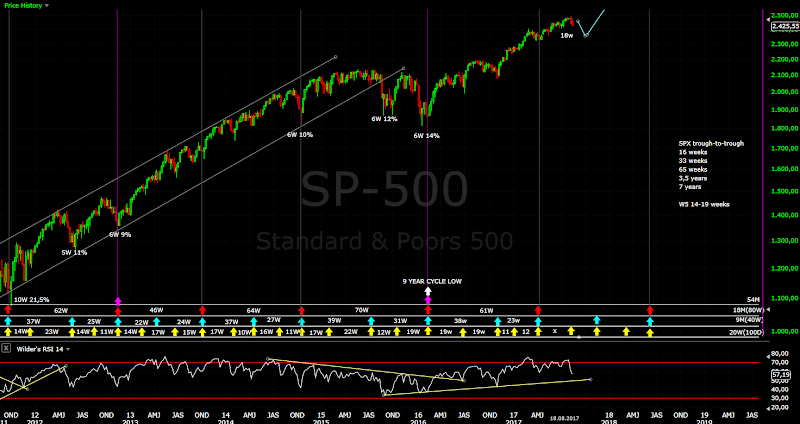
Short term view - short term bottom and move higher.
Intermediate term view - difficult to see something very bearish at the moment..... I am not sure if a correction is running or there is one more high(SP500 and DJ other indexes made a top already).
We did not see one more low for an impulse, the market just continued with the retracement higher and another leg lower. So far I see only a-b-c from the top... not very bearish. The only bearish option is the indexes to accelerate lower for wave 3 which I do not think it will happen, even one more higher high looks better (see last chart).
Possible corrective patterns if a correction is already running - wave A of a zig-zag or wave 3 of a diagonal for wave A of a zig-zag.... and this zig-zag could be part of a triangle or combination.
TECHNICAL PICTURE and ELLIOTT WAVES
Short term - I think move higher is coming. If it is a corrective and stays below the resistance zone it is wave B. If it is impulsive and break trough resistance - one more high for the end of wave 3 on the daily chart.
Intermediate term - the pattern looks corrective may be part of a complex combination or triangle.... even another high is possible.
Long term - expecting correction wave 4 followed by another rally higher.
MARKET BREADTH INDICATORS
Market Breadth Indicators - the McClellan Oscillator says we should expect a bottom, but a short term bottom. All other indicators are pointing lower.
McClellan Oscillator - making a second trough probably with divergence.
McClellan Summation Index - sell signal.
Weekly Stochastic of the Summation Index - sell signal.
Bullish Percentage - sell signal.
Percent of Stocks above MA50 - heading lower still elevated levels.
Fear Indicator VIX - not so funny anymore if you are short volatility.
Advance-Decline Issues - here is why this decline is different than May 17th - majority of stocks are declining. We have a sell signal and even if we see a higher high I expect a divergence and intermediate term top. So as I wrote in comments this is a mirror picture of May 17th the market is topping compared to bottoming back then.
HURST CYCLES
Day 31 of the 40 day cycle, nearing a bottom.
Week 18 we should be close to a bottom.
Tom Demark SEQUENTIAL AND COUNTDOWN - this technique spots areas of exhaustion.
The weekly chart still pointing lower. The daily chart - this sell off came one day later and the setup was negated. This is a hint that is more likely that we have a-b-c lower and not an impulse.
Nasdaq (QQQ) does not look bearish either. May be some kind of a diagonal for A and B should follow.
The same on the daily chart.
DJ - again acceleration lower for bearish pattern when the index is above MA50 looks less likely. Even higher high looks better, unless some unexpected bad news hit the market.
Subscribe to:
Post Comments (Atom)


Hi krasi,
ReplyDeleteThanks for your update. For sure this coming week will be very interesting as it looks like the inflection point of whether it plunges lower or retraces higher as you suggest. Are you concerned that we were not able to regain 50 dma Friday?
From the trading stand point, I find that move lower below the low of Friday would put the bears in control. Whereas move above the high of Friday would be short term bullish.
What do you think.
Thanks again for qqq analysis.
Kali
It is a concern for the bullish case a new high. Wave B to test MA20/MA50 is not a problem.
DeleteThe bears will be in control only if the indexes continue to plunge lower on Monday for another 2-3 days for wave 3 of 3 anything else is corrective crap.
What is your view on xbi?
ReplyDeleteThanks
Something corrective higher is running.
DeleteDo you still see spy moving higher?
ReplyDeleteYes, at least resistance should be tested and even higher high is possible.
DeleteDo you mean SPX resistance at 2454? Has it been tested yesterday and today? Thanks.
DeleteNo, higher 2465-2475
DeleteFrom cycle point of view, how long do you expect the intermediate term correction? Or wave 4 in your long term chart above, the correction down to 2300. I recall you mention this correction shouldn't be too long and last about 3 weeks, or say early September? Thanks.
DeleteBefore the beginning of the correction I wrote two options - sharp and short living to scare the traders or long in time with whipsaws for months so that traders chasing quick money lose interest.
Delete3 weeks later I do not see sharp correction only a-b-c correction lower. I would say the second option is more likely and if I read the cycles right the low should be in November.
This is almost impossible to trade on intraday basis. We get gaps right out of the gate. Then 50% of the move is over. Rest of the day wrestling for few points... it's pointless without a clear direction....
DeleteKali
It is not a surprise this is b of b of a..... corrective crap wave 4.
DeleteHi Krasi, thanks for updating us your view.
ReplyDeleteWhat's your medium and long term view on Shanghai composite index?
Thanks X 10000!!
Daniel
Corrective pattern higher from the early 2016 low. It has more to go before it is finished at least one more leg lower and one higher.
DeleteProbably it will be finished when the US markets make their top sometimes in 2018.
THANKS!!!
Delete