Short term view - short term bottom and higher.
Intermediate term view - a few weeks lower for 20 week cycle low and intermediate term low.
I think the mega bullish count 1-2 i-ii and third wave is dead and the market confirmed what I was explaining for a few weeks. Because of the same reasons(too much strength) I do not see a third wave lower either. At the moment with so many corrective waves there so many possible patterns - we can only guess.
To sum up:
- we have a messy corrective pattern and one more higher high is expected(red or green daily chart).
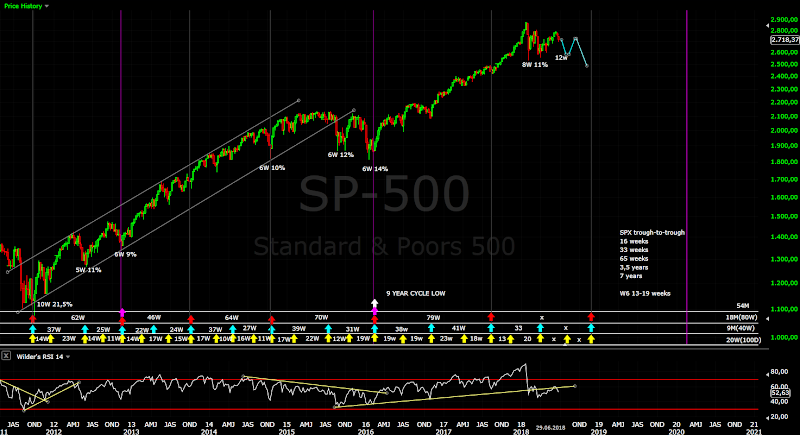
- we saw the top for the move from Feb.2016 and much bigger wave 4 is running with a low late 2019 for a 4 year cycle low(yellow daily chart).
What is tradeable - looking at indicators,cycles and market breadth we should see short term bottom, retracement higher and one more leg lower for 20 week or 18 month low - it depends on how strong the sell off is, then final move higher.
TECHNICAL PICTURE and ELLIOTT WAVES
Short term - one more low for a finished impulse and test of the lower trend line will look much better.... then testing resistance/MA200 and closing the gap.
Intermediate term - the current guess:) Bullish patterns - finished diagonal and wave 2 lower(green), A-B-C for wave IV(red) and V begins. Bearish - I do not believe in wave 3 lower, more likely some complex corrective pattern. Maybe complex b(yellow) for a huge B wave.
Long term - One more high before a bigger move lower. I can not say with higher high or not, but we will know when the time has come.
The histogram made a huge trough comparable only with the panic in 2008. It is more likely to see a higher trough with a divergence than a third wave lower. The options are finished correction and a rally higher(red/green above) or a huge correction for the indicator to reset(yellow above).
MARKET BREADTH INDICATORS
Market Breadth Indicators - turned lower, but not close to oversold levels. Probably a few weeks before we see intermediate term low.
McClellan Oscillator - below zero.
McClellan Summation Index - sell signal.
Weekly Stochastic of the Summation Index - sell signal.
Bullish Percentage - sell signal.
Percent of Stocks above MA50 - in the middle of the range .
Fear Indicator VIX - turned up, usually we have a bottom with VIX in the range 22-24.
Advance-Decline Issues - turned lower in the middle of the range.
HURST CYCLES
Day 23 of the 40 day cycle. I think we should see one more time up and down for a finished 40 day cycle.
Week 12 of the 20 week cycle. It is interesting how this move lower will look like. If we see strong sell off the low could be 18 month cycle low - the alternate count which I follow.
Tom Demark SEQUENTIAL AND COUNTDOWN - this technique spots areas of exhaustion.
We have finished buy setup on the daily chart and price flip lower on the weekly chart. The move lower has strength.
Subscribe to:
Post Comments (Atom)


thank you
ReplyDeleteIt looks that bottom has been here today? Do you think wave 5 will finish at around 2680? Thanks.
ReplyDeleteI can not say at the moment. We have to wait and see if we have continuation or not.
DeleteAt the moment is only a-b-c up it could turn lower to finish impulse or it just can continue higher.
Markets 2 oversold here to drop
ReplyDeleteI do not see a single indicator suggesting oversold conditions. A few days up and down and it can continue lower without problems.
DeleteHow likely is it that we get a buying opportunity on Thursday or Friday on weakness? Any thoughts?
ReplyDeleteOne more lower low will look good for a complete pattern. If this is the right pattern it should occur in the next 1-2 days. I would say the probability is high. But I think this is only short term low and not the intermediate term bottom.
Deletehttp://stockcharts.com/h-sc/ui?s=%24OEXA200R&p=D&b=2&g=0&id=p19758856802 - this one is oversold
ReplyDelete