Short term - overlapping mess probably diagonal. The important message - it is not an impulse. You can count a-b-c or 1-2-3-4-5(diagonal) it does not matter it smells like intermediate term low.
There is a slight chance to see one more low if you count the high on Tuesday as wave 4 and than a diagonal which needs one final low. The problem with this count is at the same time you count strength fifth wave extension and in the same time weakness diagonal.

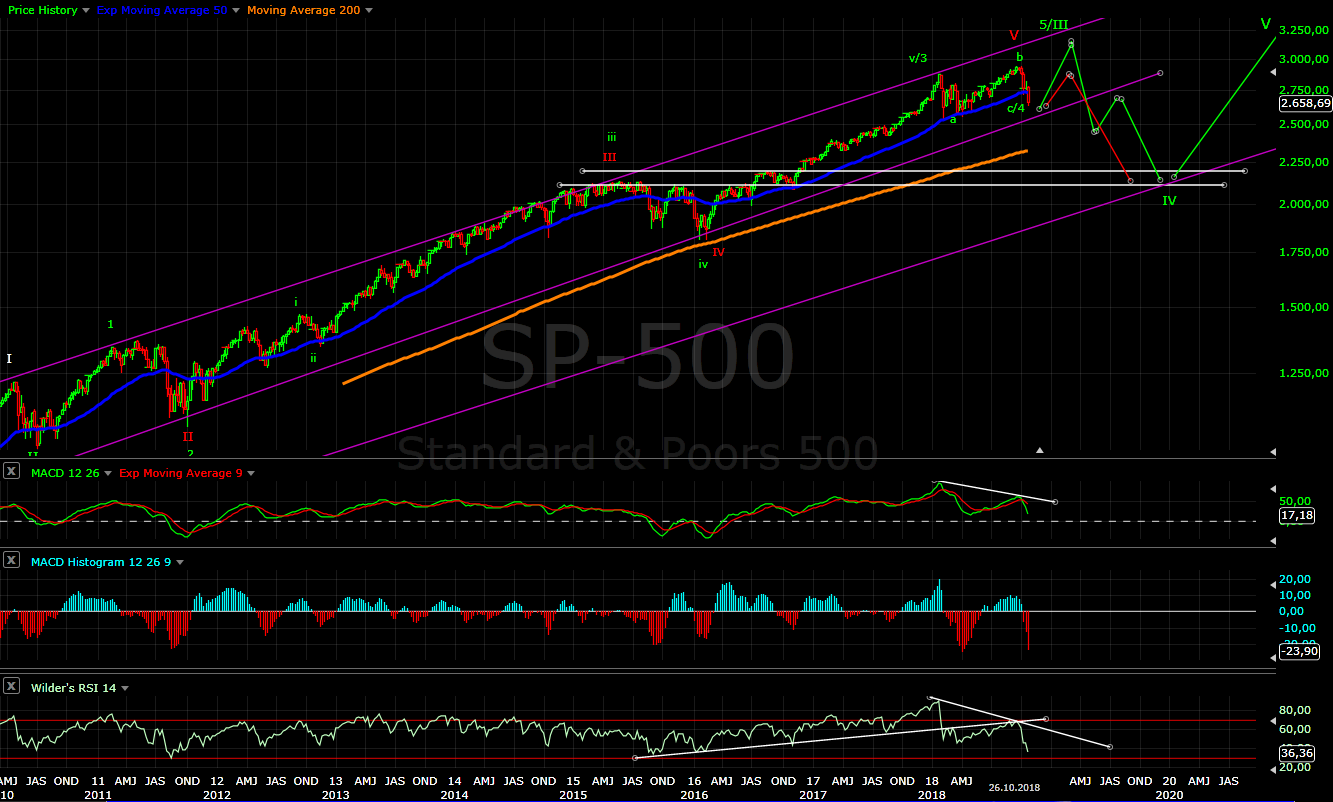
Intermediate term - the lower trend line was touched if you ignore the long shadows, this is ok with trend lines. What happens next? There is two options - one more ATH(green) or B(red) to the resistance zone. We will have enough time to decide which one it is... no need to choose now.

Long term - the same on the weekly chart - ATH(green) for the bullish scenario, H&S for the bearish(red).
MARKET BREADTH INDICATORS
Market Breadth Indicators - extreme levels common for important corrections and divergences. Interesting is on Wednesday we saw huge sell off and A/D issues and the McClellan Oscillator barely moved lower.... most likely only a few big names moved the indexes lower.
McClellan Oscillator - after extreme we have triple divergence.
McClellan Summation Index - sell signal, very deep dive since 2009 only in 2016 at 4/8 year cycle low we saw such deep move lower.
Weekly Stochastic of the Summation Index - sell signal, at oversold level, waiting to turn up.
Bullish Percentage - sell signal, only in 2011 and 2015 we saw lower levels.
Percent of Stocks above MA50 - another extreme with divergence.
Fear Indicator VIX - lower high and divergence.
Advance-Decline Issues - did not move lower after such fear and sell off.... strange my only explanation is a few big names dragged the market lower.
HURST CYCLES
Day 35 for the 40 day cycle, the indexes are close to a bottom or it was hit already.

Week 17 for the 20 week cycle.... it looks like 18 month cycle low to me.

I showed NYSE chart and explained why we have big correction and it is wave B up. Below the updated chart - I am "shocked" what happened. The worst what we can see is the expected test of the low in November to be a lower low, after that it is multi month rally up.

DAX exactly the same the indexes are synchronized at important highs an lows and at the end the pattern is the same.

Market breadth percent of stocks above MA50 - in a bull market it moves in overbought territory stays there for months and correction pushes back briefly to oversold level followed by quick move to overbought, in a bear market it is the opposite. What we have in January - April oversold for a few months push to the upper boundary failed despite the "strong rally" and plunged to oversold again. Classical indicator behavior.
What we have? - a-b-c Do you get it why I was explaining correction no 3200? Do you think I was wrong? I will dear to say I was right, than will some one explain me why this is not just wave C and it is something else?

Crazy volatility if you blinked and you missed the bottom.... 100 points from the top and 40 points in 15 minutes before the close.
ReplyDeleteI thought the probability is low for another lower low, but now we have it rare expanding ED to finish a-b-c from the top.
Thanks for the update. How about Gold/gold miners? Ready for another big wave down?
DeleteCrazy volatility indeed, gains reversed and lower low ... do you think this is the bottom?
DeleteBelow 2600 on SP, 6700 on NQ looks pure ugly.
Thanks for the good work!
No more lower lows the pattern is finished.
DeleteThanks man, today Asia price action seems to suggest this as well. But it's been roller coaster all week.
DeleteYes, indexes like SSEC and HSI with finished impulse lower so the same story multi month move up.
DeleteGold miners with impulse lower so there should be more to the downside(short term some retracement higher expected after the impulse lower).
DeleteWell done...you nailed it
DeleteI have explained this so many times - bear markets do not start with explosion. Fear is very strong emotion and the fuel will be burned too fast. The big boys need to unload their shares. This move behaves like correction in a bull market punishing greed.
ReplyDeleteThis is data From Thursday now it is top 5 with 11,4%
https://twitter.com/ukarlewitz/status/1057066888553914368
still so weak... any ideas? Thanks.
ReplyDeleteThe same bottom and 1-2
DeleteI agree Krasi - if not in already , then anywhere down to 2630 for the end of two then a big rally Weds/Thurs. 2730+ possible I'd have thought
ReplyDelete2725/2750 and 7050/7100 before next leg lower now?
ReplyDeleteI think MA200 will be tested then lower to test the low.
DeleteWas that the 200DMA test overnight, we head lower now?
DeleteIt is too early next week.
DeleteHear you there, but word on street is call for bounce to 2750 as well and if it's anything that hasn't worked this year it's consensus trades. Probably choppy price action upwards, I think AAPL shock is due.
DeleteDefinitely it should be choppy, V shape bottom is unlikely.
DeleteAAPL needs one more high for a finished pattern.
Looks like Trump has determined markets oversold and he needs a boost ahead of midterms. Feels Dma give out to upside.
DeleteWould prefer retest of lows to make it clean to year end, otherwise more noisy markets.
Amazing! SPX Sept-Oct = -338 points then Jan-Feb = -340 points. Can the market be so precise where A = C? Why haven't we retraced at least 38.2% for a wave 4 since 2009?
ReplyDeleteThis will happen later in 2019 with 4 year cycle low.
DeleteSo you think we had a running flat, even though I keep hearing how rare it is?
ReplyDeleteThe theory says a flat is 3-3-5 structure and we have 3-3-3.
DeleteSome are counting wave 5 finished and zig-zag lower of much bigger correction.
For me we have huge corrective structure from January well visible if you look NYSE, to be correct we should label it W-X-Y.
It is all just a theory, we will see a move higher for a few months. Some indexes will make lower high like EEM/SSEC/HSI, for the US indexes at this point we can only speculate. I will not be surprised for example to see SOX with fifth wave higher and SP500 with corrective wave X testing the last high or even fifth wave above 3000 too.
Why can't you call the down move from October, 5 waves with the 5th wave being an ending diagonal? Is it because in that case the 4th wave would be much larger than the 2nd wave?
DeleteThere is no impulse just zig-zag with a=c
DeleteDo you think short term top is here and another wave 2 down to test the previous low or it should continue higher to above 2800? Thanks.
ReplyDeleteDifficult to say... one more high around 2770 will look much better for a finished impulse, but the indexes must recover from the sell off today.
Delete