Short term - the move higher looks like a-b-c, but we need reversal lower next week for confirmation. According to RSI this is the final move. We could see higher high with divergences to test the trend line, but that is all.

Intermediate term - the trend line is tested for the second time. Even if we see one final higher high it will be short living and create divergences. Break outs did not occur with overbought indicators and divergence. Pullback to reset the indicators and then break out.
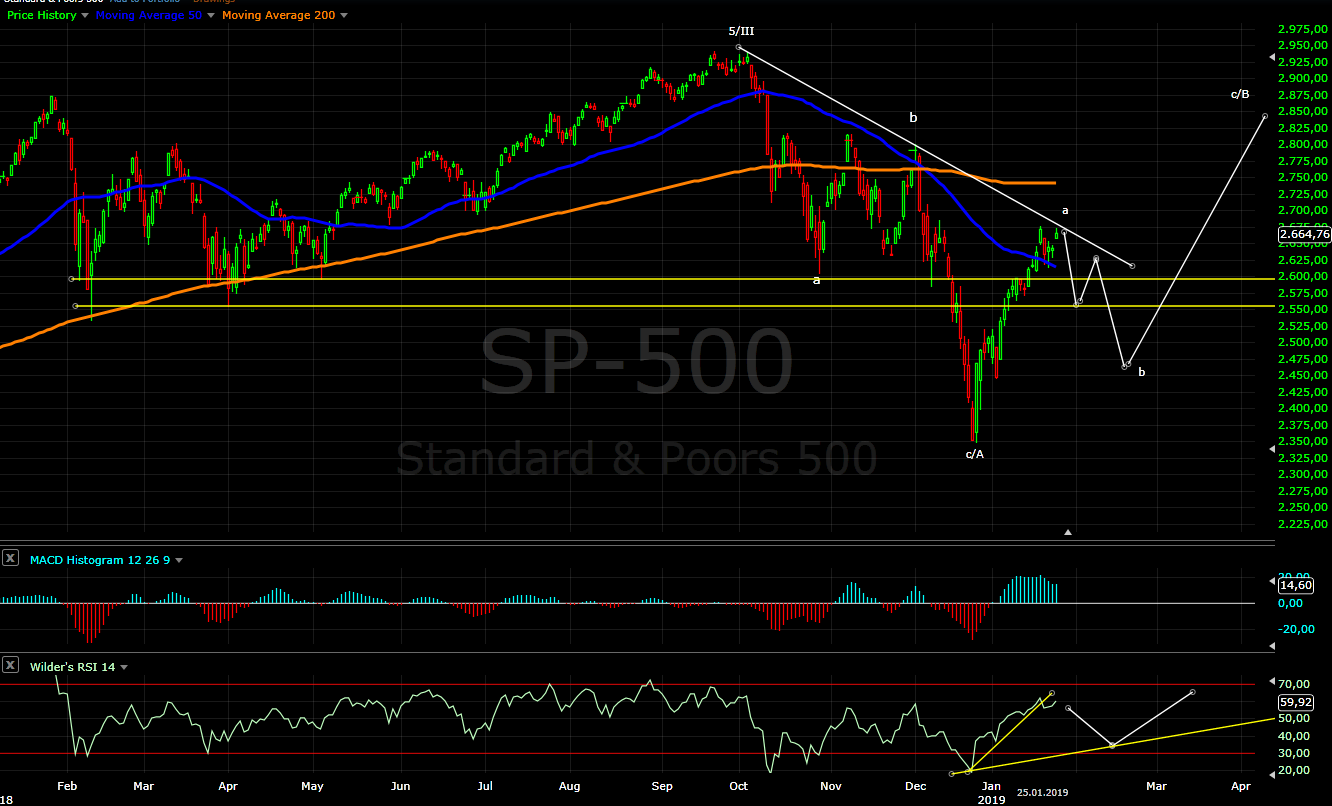
Long term - wave B running for IV from 2009. Possibilities are simple zig-zag or triangle to burn time.

MARKET BREADTH INDICATORS
Market Breadth Indicators - the oscillators turning down from very extended levels, the trend following indicators with buy signal.
McClellan Oscillator - extremely overbought and double divergence.
McClellan Summation Index - buy signal.
Weekly Stochastic of the Summation Index - buy signal, reached the overbought level.
Bullish Percentage - buy signal.
Percent of Stocks above MA50 - reached the 75 level and making a pause.
Fear Indicator VIX - we should see a move higher for the VIX and lower for the indexes.
Advance-Decline Issues - turned lower.
HURST CYCLES
Day 21 for the 40 day cycle.

Week 5 for the 20 week cycle. Shorter cycles possible 40 week low in Dec.2018 so we will keep an eye how fast the pattern develops.

Quite like the green route short term , if we could print a lower low than yesterday today , but hold above 2600.
ReplyDeleteWould set up a short term rally back to the recent highs or above and the market seems to prefer the more complex patterns...
Yes, one more high is possible... but it should not last more than a few days.
DeleteKrasi, when you say "Shorter cycles possible", what do you mean?, what is the alternative?
ReplyDeleteThe nominal cycle length is 18 months and 54 months(4,5 years). The obvious cycle count is shown on the chart above close to the nominal length. In my opinion the US indexes have shorter cycles and this 54 month cycle is 3,5-4 years long. So I will not surprised to see 4 year cycle low in the summer or October-November and not in 2020.
DeleteSo flat and higher is playing out(green from the first chart). From the low(28.01) I see clear impulse currently in wave 4 lower to 2670-2675 and one more high w5 for intermediate term top.
ReplyDeleteMarket manipulation at its finest Look Out Below boys and girls
ReplyDeleteYou must work on patience:) Just let the patterns play out. It was the same with the move to upside - jumping too early.
DeleteHi Krasi! Thx for your comments! Do you mind expanding a little bit on the green scenario.. do you see it reaching an intermediate top early next week and reverse with the same downside target as the red scenario? Thx a lot!
ReplyDeleteThe high should be Friday/Monday the target is the same 50%-61,8% retracement.
DeleteOne interesting pattern is complex a-b-c lower with expanded flat for a. It counts well, Fibo levels fit perfect. The outcome is not different just in theory the high is already behind us and it was on 18.01.
ReplyDeletehttps://imgur.com/a/7vRxH5V
or a 1.38 extension to 2699....?
ReplyDeleteOr 1.38 extension:) Now there is finished impulse from the 28.01 low.
DeleteIn both cases flat for w4 or expanded flat we should see a top.... curious what happens next.
or 1.618...
ReplyDeleteToo much for expanded flat - either w5 to finish an impulse..... or I have the suspicion it is a double zig-zag. It does not matter the next bigger move should be lower.
Delete3
Hi Krasi! What kind of double zig-zag do you have in mind?
ReplyDeleteInstead of single zig-zag for a/B I can count two zig-zags and 61,8% retracement from the September high. So this could be the whole wave B.
DeleteI know everybody count impulse and it looks like impulse... but something feels wrong.
And b/A. ? Then c/A about 2250.
ReplyDeleteOr perhaps abcxabc and all the correction finish about 2250 but i dont know if it is possible with your cycles
Main scenario is still a-b-c/B running, but now we have 61,8% retracement so watching closely how the next decline will develop because this could be the whole B wave.
DeleteIf we see one more decline to 2250 it is not c/A, the correction is over w4 from 2009 and w5 begins.
Krasi, My sense is that everyone is FINALLY in agreement with you that the bull market is not over and everyone is looking for an entry point to get long, so why can't we go to 2900 or so for B? Other than Trump announcing 'no deal with China possible' + 'applying tariffs in March', I don't see anything on the calendar that can stop this freight train. There have been multiple opportunities for bears to take control and they've dropped the ball every time... is there a historical precedent for the B you are describing for SPX? Every B I can think of for SPX has been a flat vs ATH or even a higher high, but my EW understanding is weak. Basically I feel your conviction but I don't want to be short if you think a new ATH is hypothetically 'possible' on this move higher for B.
ReplyDeleteThank you for all your great work!
p.s., I hope SPX is down 5% tomorrow morning so I can feel like a fool for writing this :)
I have no problem with B reaching 2900 I just do not think it will be a straight line.
DeleteIt is always the same - last year September minimum 3200 so strong it will never go down, December the bull is over comparison with 1929/2008 it will never go up, now is the same so strong no way to go down...
When I see the McClellan Oscillator with extreme and double divergence means strength and continuation but it is time for correction(right on time with finished EW pattern). Or with another words a with b and c to follow.
What would be your target for C is the whole B is finished? THX!!
ReplyDelete2300 and 2200
Deletekrasi what is your time frame on 2300 spx your thoughts
DeleteThis is the less likely scenario. I expect something like 2500 probably mid-March then 2850 in June and then 2250 Q4.
DeleteWhat do you think?
ReplyDelete02-04-2018 abc(A), 17-09 a/B, 24-12 b/B, now c/B 2728
Then C=161A around 2250
Too strange B wave. I do no think this is the right pattern.
DeleteIf I count the top in 2018 it will be big zig-zag for A Jan-Dec.2018 and now big zig-zag for B running and this is just a/B.
Do you mean 2500 mid-February, or have your changed time frame for the bottom to mid-march? Thx!
ReplyDeleteMid-February should be the next low, but I doubt that it will take only 2 weeks vertical drop and reversal higher. I suspect it will take longer and more complex pattern.... something like late February to early April 2018.
DeleteHi Krasi, do you still expect a pullback in gold stocks, they are starting to look impulsive to me.
ReplyDeleteNot just pullback lower lows this year for 4 yer cycle low. This is just big a-b-c from the lows in September.
Delete