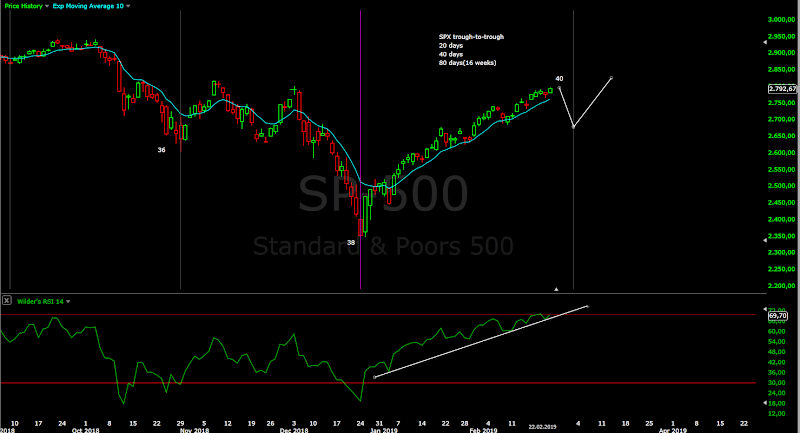
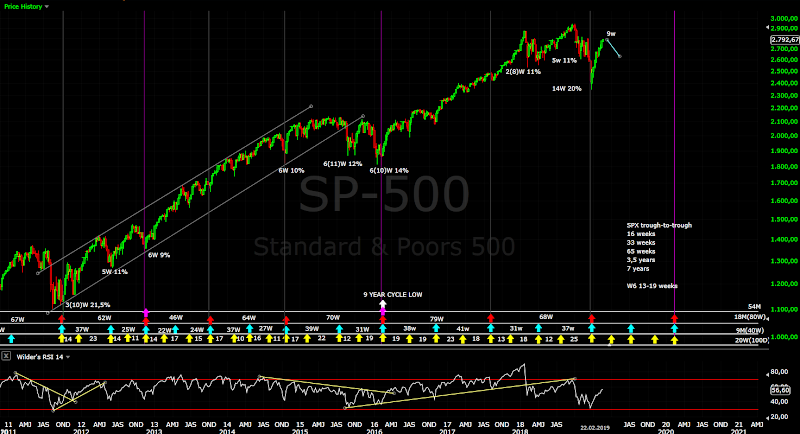
Nothing new this week - the indexes squeezed a few points higher (SP500 17 points from Friday) and reached serious resistance zone. I see some count it as impulse w1/V.... I see two legs up and so many shares and indexes with corrective patterns.... but market breadth says major low(thoughts in the comment section)!?!? I will not forecast, I will just wait to see some kind of finished pattern for a high and what happens next - how the 20 week cycle low looks like. The first decline should be short living and it will be bought so no need to make decisions.
TECHNICAL PICTURE and ELLIOTT WAVES
Short term - the impulse count with green labels... I do not like it much. First RSI does not look like impulse more like two distinct legs and second the rally lasting 9 weeks already and wave 2 is only a few hours barely visible on RSI hourly... this does not feel right.
I see two legs higher with wave b in the middle and waiting now to see some kind of finished pattern.
RUT for example looks like this to me - two impulses for a zig-zag. Green 5 is where it corresponds to SP500 impulse... we will know soon, the next leg will show us which one it is.
Intermediate term - reached a zone which was a resistance for six highs on previous occasions. Impulse or not in both cases it seem it is time for a high.
Long term - wave B running for IV from 2009. If I am wrong it is an impulse and it is wave 1.
MARKET BREADTH INDICATORS
Market Breadth Indicators - double divergences for the oscillators like A/D line and the McClellan Oscillator. The trend following indicators are still pointing up. Expect short living pullback and higher, while market breadth building divergences.
McClellan Oscillator - triple divergences...
McClellan Summation Index - buy signal, very extended levels.
Weekly Stochastic of the Summation Index - buy signal, in overbought territory.
Bullish Percentage - reached the 70 level.
Percent of Stocks above MA50 - topping at very overbought levels.
Fear Indicator VIX - entering a zone where we should see a low.
Advance-Decline Issues - divergences no broad based advance anymore.
HURST CYCLES
Day 40 for the 40 day cycle. Into the timing band for a low and strong right translated cycle. This means the decline should be short living.
Week 9 for the 20 week cycle. The second option shown last week with shorter cycles.
Tom Demark SEQUENTIAL AND COUNTDOWN - this technique spots areas of exhaustion.
TD Sequence finished as expected now waiting for price flip.
Subscribe to:
Post Comments (Atom)


My favorite market breadth indicator is the McClellan Summation Index. If you look at it, it moved for 9 weeks from extremely oversold levels to extremely overbought.
ReplyDeleteExtremely oversold like major lows 2002/2008 and extremely overbought like the rallys in 2003/2009/2016
We are talking about big bear markets and major lows and rallys from 9 year cycle lows in all three occasions. 2018 is not even close.... plus I am seeing so many corrective patterns this is very confusing.
What I will do - waiting:) patience and wait for the market to show it's cards - B or 1/V.
We will assume market breadth is right and this means major low, w1/V and last final mania phase. If this is the case expect something like on the charts below. In all three occasions we have the same outcome 2 months up 2 months flat correction for 20 week cycle low and much higher.
I was talking about this down-up-down sequence for some kind of flat for b/B and 20 week cycle low, but now the move is too large and if we see such pattern it is 2/V buying opportunity.
If I am right about the corrective patterns we must see conformation first - impulse lower for 40 day cycle low and lower high for the next 40 day cycle. The high of the second daily cycle is the time to be short even in both cases bearish and bullish so patience....
The bullish case we should see something like this:
2003 - 13 weeks up(but 3 correction in the beginning) 9 weeks flat https://imgur.com/a/jspvoQz
2009 - 9 weeks up 9 weeks expanded flat correction https://imgur.com/a/LyiSarI
2016 - 10 weeks up 9 weeks expanded flat correction https://imgur.com/a/0SPvZ2H
Hi Krasi -- my non EW timing work off lagging sectors point to mid March for top.
ReplyDeleteEMs, Energy, Japan, Materials .... maybe SPX etc turns down without dragging these along.
But I wouldn't bank on that.
So if these others are being honest ... then your RUT count squares up for me IN TIME.
It is tricky with correlations... it is not necessary to be exactly the same but it rhymes:)
DeleteIt could be simple tops at the same time in March like my fist two charts or:
- in the bullish case impulse and flat correction technically the top is now but it makes second high a few weeks later(see the charts in the first comment)
- in the bearish case sell off, but most of it retraced(cycles/breadth a lot of strength) with slightly lower high example is DAX/SP500 correlation May-July 2018 http://schrts.co/EFubrKHF
I think we make a move to 2810, we clear and it melts up to 2840 maybe 2900 on short covering. Very extended at that point and ripe for the C wave pull back... If we don't clear 2810 I think we see some corrective consolidation without a major move lower and slowly push higher for the the rest of the B wave.
ReplyDeleteThe first chart - wave 3/c/B 2810, wave 4 ~2760, wave 5 ~2840.
ReplyDeleteI think we have started a new 40 day cycle, now decline
ReplyDeleteIf we see a decline for a few weeks yes with 40 day cycle low on 8th of February.
DeleteIf we see just a few days 5-7 it is still the first 40 day cycle.
Current patterns which I see - https://imgur.com/a/yxcDiFs
ReplyDeleteOne more touch of the trend line as expected probably for 3/c/B. As long as the support area holds we have w4 and one more high. If we see break below it with impulse what left is bunch of zig-zags with perfect Fibo measurements including the internal waves...... so the bulls should pray now that the pullback stays above 2750:)
There is bearish RUT count too - https://imgur.com/a/Qeas29k
ReplyDeleteNot a triangle just short b and extended 5/c.
It is getting interesting:) One more high or not...
krasi what is your s and p target
ReplyDeleteFirst 2760 than 2840.
DeleteYou might see 2840 first
Deletekrasi do you still believe that BA will "crash" below 300? You posted a chart 2 weeks ago about it...
ReplyDeleteI want be surprised to see it happening, what goes up vertically comes the same way down.
Delete