Aug 23, 2019
Update
I am away for 3 weeks again... the next weekly post should be on 15-th of September.
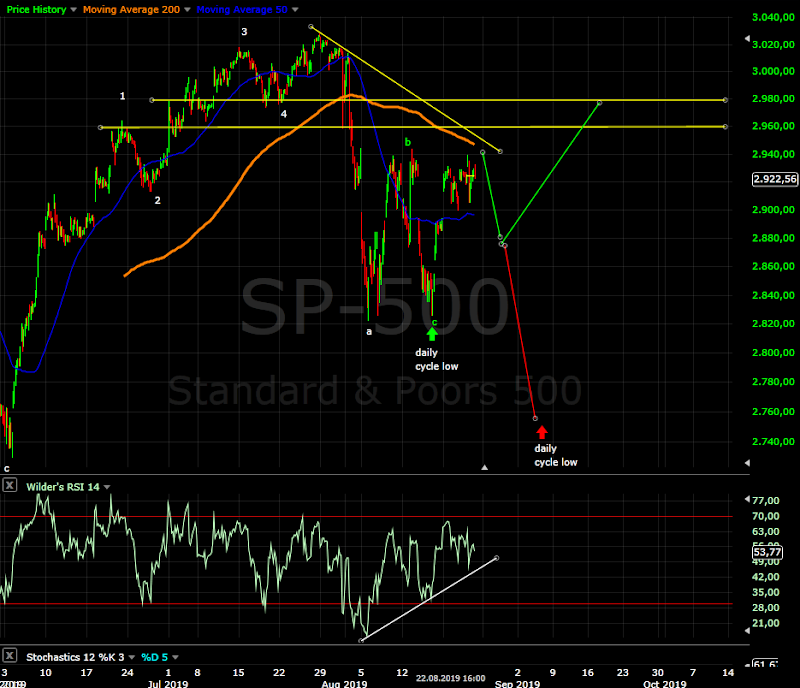
Short term - we saw sharp sell off yesterday, but it takes too long and the retracement is too deep so the probability for wave 2 is very low. Confirmation for a move in the opposite direction is break below 2900 until then the pattern can easily extend higher.
This is hourly chart futures I see impulse and I suspect that w3 of ED is running for the fifth wave.
The big picture has not changed - I see leg lower and corrective move higher.
Intermediate term it looks like the flat is near to competition and another leg lower(red) should start.
What if I am wrong? Than we saw daily cycle low on 15-th of August and much more ugly patterns are running a-b-c(green) and now a of another zig-zag higher(green path).
There is a lot of resistance in the 2940-2960 area so at least we should see a pullback
If you see break below 2900 with impulse it is red, if you see choppy move zig-zag just to close one of the gaps it is the green one.
Subscribe to:
Post Comments (Atom)


It looks like ascending triangle on s&p futures is complete and resumption of the downtrend today. S&p cash has a flat and it looks completed now... a crash coming Krasi. I would not be surprised if the coming Monday goes into history as a black Monday. Thank you for the post and have a great holiday.:)
ReplyDeleteThanks for update, enjoy the holidays!
ReplyDeleteTime to spend some of the gains from the 3x ETFs :) don't spend it all 3x speed !
looks like impulse below 2900.
ReplyDeleteis this going to be a 5 wave decline into 2720-2730?
thanks and have a great vacation
Krasi, hope you are laying on the 3x shorts from your vacation yatch :)
ReplyDeleteThank you for posting it, it is very helpful.
ReplyDeleteBig sell off is coming, possibly tomorrow
ReplyDeletewhat basis on an article give me a break!!!!!!
DeleteI should have been more clear... check IWM making new low at important support. It’s a leading indicator and it does not look like it’s bouncing from here.
DeleteLooks like it's over already
ReplyDeleteLast Friday the sell off was too big too fast and ruined the pattern, impulse lower has not been confirmed and the green scenario from above is playing out.
ReplyDeleteWe have daily cycle low mid-August and now it is confirmed - see DJI,NYSE for more clear picture.
Futures chart - https://imgur.com/a/1nfFZFl
I see a-b-c with complex b wave, which has the same target like above 2980 and synchronizes with the cash index.
How do you know daily cycle low is confirmed?
DeleteSee the daily cycle chart from the previous post - MA10 cross, RSI break of the MA or the trend line are the triggers. In this post I wrote that we have potential cycle low because price/RSI tested the MAs moved lower and reversed higher again so there is potential for break higher. Now all this is confirmed.
DeleteThis is another chart which I watch(MA5 of mcclellan oscillator) very good in spotting daily cycle lows - https://stockcharts.com/h-sc/ui?s=%24NYMO&p=D&yr=2&mn=3&dy=0&id=p33629912098
thank you
DeleteThen the 40 week cycle low will be earlier than expected, instead of November, it will be mid October around 45 days for the next daily cycle.
ReplyDeleteThe target has been reached and we have potential a-b-c pattern. The move is definitely corrective and I see only two possible scenarios - https://imgur.com/a/IWV026j
ReplyDeleteThe top is in and the next leg lower is around the corner. The only way to see this move "bullish" is if c/B is big ED and we are in the middle of the third wave. We will find out in the next 1-2 weeks.
the move is corrective but the whole move from December has been corrective, so it's not saying much. I think the top is not in yet and we could make one more new high at around 3050. To me this looks like an expanded flat from august lows.
Deletesorry I meant zigzag that completed on Aug 26th, now final corrective move up
DeleteHow is it tops which take days or weeks can be called corrective, and a "correction" can make new highs for days??? Yet a bottom last seconds in a blink of an eye it's over... and we are supposed to wait for weeks or months to hopefully wait for one more lower low which i dont even care about. Krasi..pls help me get out of caring for this 5th wave
ReplyDelete