Short term - the same like last week. Lower high and we have w-x-y for b wave. Higher high and we have a-b-c probably the final zig-zag for a big ED from Dec.2018

Intermediate term - expect a high in September and lower in October. I think the indexes will squeeze higher high with possible ED for 5/III.
Multiple divergences on MACD and RSI.

Long term - one more decline into 2020 to finish the correction. B wave if we see lower high or 5/III if we see higher high with ED from Dec.2018.
Multiple divergences histogram and RSI.

MARKET BREADTH INDICATORS
Market Breadth Indicators - resetting higher and now with multiple divergences signaling important high around the corner.
McClellan Oscillator - resetting lower, probably one more push higher for divergences.
McClellan Summation Index - buy signal, double divergence.
Weekly Stochastic of the Summation Index - buy signal.
Bullish Percentage - buy signal, double divergence.
Percent of Stocks above MA50 - buy signal, double divergence.
Fear Indicator VIX - I expect one more leg down and reversal with multiple divergences.
Advance-Decline Issues - lower from overbought level, probably one more push higher with divergence.
HURST CYCLES
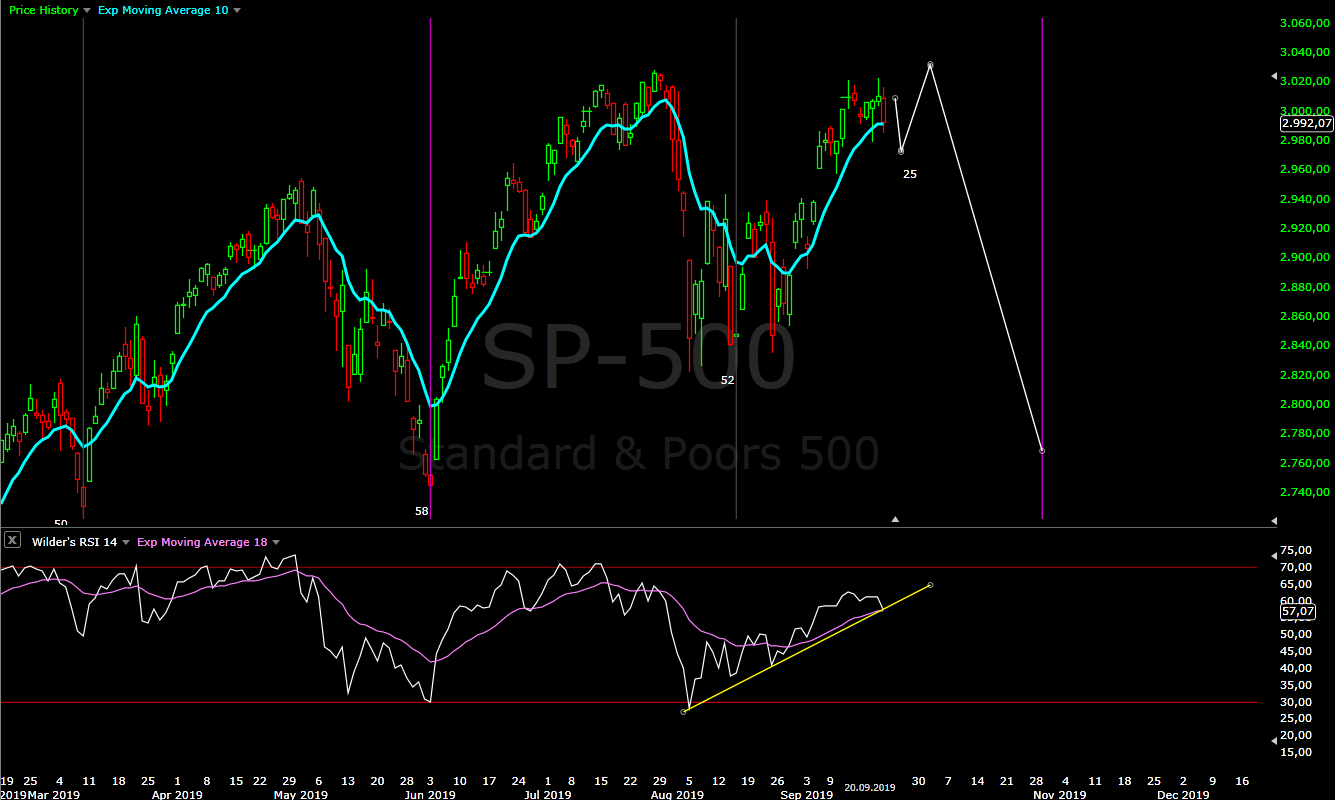
Day 25, it looks like half daily cycle with price testing MA10 and RSI testing the trend line and the MA.
Week 16 for the 20 week cycle, reversal lower should be imminent.

I think this is a B wave or X wave from Dec Lows. You can have triple combo correction, so it doesn't have to be Ending diagonal. One more high is likely.
ReplyDeleteAll indices are acting/looking differently. Looking at IWM, the C wave or Y wave that follows is likely to be a zigzag and not in 5 waves. The index that shows a potential expanded flat picture is NDX and SPX, IWM did not retrace more than 61.8 retracement, (this does not fit with a flat picture) Also, alot of stocks are looking very weak like NVDA, NFLX. Hard to see if we will go down in 5 waves or 3 waves down. IWM looks like zigzag, but SPX could be 5 waves.
Yes, there is different possible pattern, which is not so important. The most important is, if the decline will be with impulse or zig-zag. At the moment I think the odds are higher for 3 waves lower.
DeleteKrasi,
ReplyDeletecan you comment on uvxy?
thank you
The low was tested as expected and it looks like reversal. The indexes should make one more higher high I suspect UVXY with higher low.
Deletethe structure since the July top is really strange looking, it doesn't quite look like a triangle. There is one EW count where the top is considered on July and right now now we are making an expanded flat, we are currrently in the b wave, the c wave will retest June lows, this can be followed by another corrective wave to the upside to get a head and shoulders which will lead to a big fall sometime in Nov/Dec.
ReplyDeleteNow it is getting interesting - if there is one more higher high left, SP500 should make a low around 2980 for a flat correction. Acceleration lower will mean we have a reversal.
ReplyDeletei am wondering if we nhave to hit 2980 exact or we could go 2978 or 2984
DeleteThis is roughly estimation... hitting the exact measurement is an exception not the rule.
DeleteI always talk about something around a level.
Now that we broke 2980 but will be You are targets on the S and P 500 would be Your target It also what Would be your target on UV xy 28
DeleteIt looks like another corrective move lower. I do not know if uvxy will hit 28 or not.
DeleteInteresting Hurst Cycles analysis that I have followed for a long time to get the idea of bigger picture.
ReplyDeletehttps://www.youtube.com/watch?v=i66F1ob8tLQ
Interesting option for a 40 week cycle in August. I think it is probable, for some time I feel something is wrong.
DeleteFirst this last daily cycle is too strong for too long and it does not fit well with the expected weakness caused by 40 week/18 month and 4 year cycles turning lower.
Second market breadth and indicators which I follow to track cycles are showing unusual strength hinting new weekly cycle higher.
We will see what happens in October... if we do not see strong move lower than the 40 week cycle low was really in August. This will push the decline into November and it will make possible decline with an impulse.
But then the second 20 week cycle was too short 10 weeks
DeleteAnother 2-3 weeks higher is not optimal either - expecting important top and weak cycle and still higher at weeks 18-19.
Deletelook at NYA, this looks like a flat we are making. NYA is the broadest index, I think we go down in 3 waves as a C.
ReplyDeleteIf you think it is a flat the decline for C must be in 5 not 3 waves.
DeleteThe 18 of september could be a cycle low of 5 weeks ?
ReplyDeleteCould be if we have reversal.... I do not know a way to confirm it.
DeleteI know you dont like this count but look DJI and NYA since 25 February, it can be an expansive triangle for b of B
ReplyDeleteI can not see a triangle... I have never seen an expanding triangle.
DeleteFor cycle fans after I see questions about short term cycles - https://imgur.com/a/RjLW7QW.
ReplyDeleteThe theory - we have 20 day/40 day/80 day(my daily cycle) cycles and one 80 day cycle consists of four 20 day cycles. All this in calender days, in trading days - 14/28/56 or 14x4=56.
I do not follow such short cycles, but looking at the chart I think I will change my mind:) You have more complete picture.
Top-to-top count(green) - the final fourth 20d cycle should be running since yesterday and we should see one more higher high to complete the 80 day cycle.
Bottom-to-bottom count(red) - two 20d cycles finished, both right translated and another higher high should be expected. After this next high the 80 day cycle should turn lower.
RSI showing weakness already with broken trend line and MA, price bounced from the cycle trend line.
I expect something like the previous high - weak final move higher and sharp decline into the 40 week cycle low.
Possible surprise - this final move up lasting longer into the second October week.... than there is high probability that the 40 week cycle low was in August.
Another option: bottom-to-bottom: 18 September second 20d cycle and the third one has already made higher high (19 September) and now go down during one week. And then 3-4 days go up for the last 20d cycle top-to-top without making new higher high and finally go down for the 40 week cycle low.
ReplyDeleteI think 19 September is the top.