Short term - the bullish hope triangle wave d is history, five wave looking move with a high above the supposed wave c.
This is a-b-c from the August low.


Intermediate term - I have posted a chart in comments last week explaining what I see. For me we have one big b/B which begun in May. Why? because it fits every index and chart I look at(see the last charts)
Three months wave a/b/B flat, 3 months b/b/B zig-zag and now it is time for c/b/B lower.
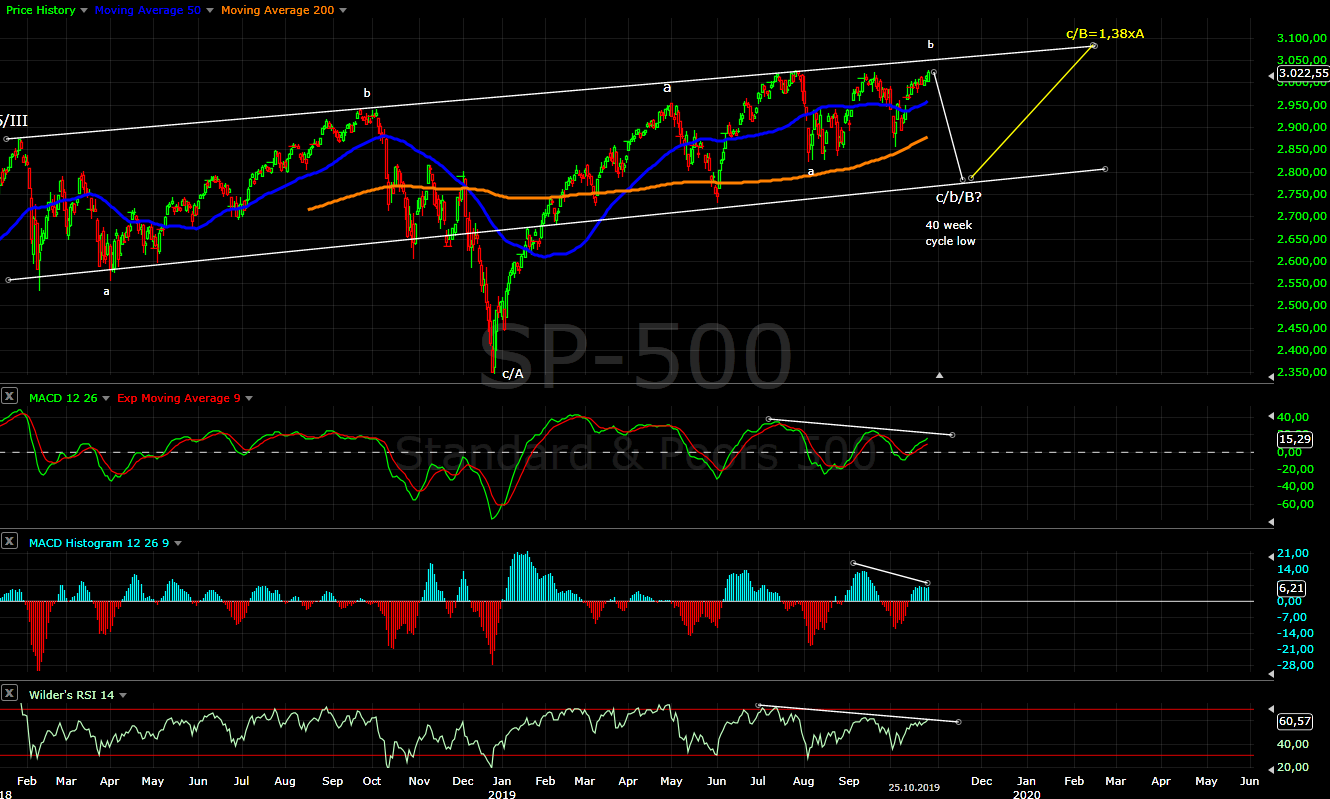
Long term - at the moment I expect a correction to be finished around mid-November. Then a rally for 3 months followed by final sell off to finish the correction which begun in 2018..

MARKET BREADTH INDICATORS
Market Breadth Indicators - turned up, but I do not see signs for important low.... more likely resetting and divergences before the final sell off.
McClellan Oscillator - above zero, but weak with short term and intermediate term divergences.
McClellan Summation Index - turned up, buy signal, but divergences.
Weekly Stochastic of the Summation Index - making a pause.
Bullish Percentage - turned up.
Percent of Stocks above MA50 - below overbought level, does not show much conviction .
Fear Indicator VIX - close to a low around 12 and spike higher expected.
Advance-Decline Issues - trying to reach the overbought level, does not show much conviction and divergence.
HURST CYCLES
Day 50 for the daily cycle(80 day Hurst cycle).

Week 21, expect sharp sell off for 2-3 weeks.

XLF shows more clear the big picture - clear zig-zag for a/B until late April, not like SP500/NDX where some try to count an impulse. From May the pattern which I am explaining for a few weeks b/B and if I am right in November we will see c/B.
I do not see impulse from Dec.2018, I do not see a reversal pattern so we are in the middle of a B wave.

EEM exactly the same story the only difference is we do not see higher highs. Corrective zig-zag until late April a/B. The following overlapping waves do not look like strong wave C reversal... it is zig-zag lower into August and zig-zag higher now - the same like SP500. The most likely outcome is again c/b/B and one more rally to finish c/B.

VIX is completing wave 5/c for a zig-zag and all this at the trend line which started two years ago. Surprise surprise the same patterns like the indexes. It is getting boring but again a-b-c from April to August, now another a-b-c lower to test the trend line and spike higher for c expected.

Crude oil has high correlation with the indexes since 2018 and despite the pattern looking different at the end it is the same. Sell off the last three months of 2018, corrective rally until April and now some corrective crap is running, no way this is reversal for wave C. Zig-zag lower into August, zig-zag higher into September and after that the pattern is different, but the outcome should be the same b/B. When there is no reversal crude oil should be in the middle of wave B.

Thanks Krasi,
ReplyDeleteI'm following someone else, who also states 3100 is possible. He uses hurst cycles. https://www.youtube.com/watch?v=moTT52fH1Gw .
I'm not that familiar with Hurst cycle, I am more familiar with EW analysis. Your prediction for a c wave down for b of B is possible from EW standpoint, but imo your broader EW count is wrong, the correct count would be like so https://imgur.com/a/w7byMQN. This is not my favorite count because TVIX facing downtrending resistance line from many years https://imgur.com/a/Bq3Q7hS, if we break that I truly believe volatility will explode and we can be down -20% very quick. If the c wave does happen it might be a failed flat or short c wave, or very choppy downward action so VOL doesn't go up too much where we bottom at the trendline of TVIX. The trendline for TVIX is very powerful it is at bottoms of 2011, 2016, etc.
The other reason is because other stocks like NVDA show a different picture, NVDA correction looks almost complete https://imgur.com/a/T1psB61.
This is my favorite count rn, https://imgur.com/a/E85BHC9. I'm predicting a top early next week of around 3030-3040. This count has a zigzag for W, then X, then flat for Y.
the alternative count I have is Y is a triangle, which is equally possible. So we will make a low around 2920, then one more high at 2960 in November
DeleteAre you aware that w-x-y is rare pattern and making a top with three waves extremely rare... some kind of exception.
DeleteSo you are telling me that rare to the power of extremely rare is more likely than a-b-c.
- it does not fit for all indexes
- time does not fit so well
- NVDA is not representative for the market
- TVIX trend line.... WTF??? meaningless. In 2011 wave 3 has begun this is the trend line for w3, so the next wave of the same degree the coming wave 4 MUST break this trend line. This is not the trend line for the bull market from 2009.
We will know very soon - if the sell off lasts 2-3 weeks I am right, in your case the first sell off should last 2-3 months until it reaches the 2700 region.
If I bet on alternative pattern it will be ED for c/B running and not trying to fit w-x-y on every chart:)
WXY is not a rare pattern, who said this? a double zigzag is a WXY pattern and it is not rare.
DeleteTVIX trendline is significant if it acts as resistance for 10 years! I never said it was trendline for bull market since 2008, I just said it is very significant and it has acted as resistance for the past 8 years, so it is something to pay attention to.
I never said the sell off has to last 2-3 months. I said we top now or in December at around 3060. The december top alternative which I see is more likely now is we are making a triangle, same pattern described but Y is a triangle so top here, sell off for 2-3 weeks than make one more new high in December.
When you say so:))) good luck with this pattern.
DeleteI'm not discounting your pattern, it is still possible. One thing going for that is the August correction is shorter in duration than the May correction, which wouldn't make sense if it is of higher degree, so it is possible we are making a flat here that will retest August lows.
DeleteI'm just trying to figure out how TVIX plays into all of this.
Very nice krasi and Anonymous
ReplyDeleteDo you know any good resources to learn about Hurst Cycles?
ReplyDeleteMastering Hurst Cycle analysis - Christopher Grafton
DeleteExcellent book about Hurst Cycles.
Krasi, I have doubts about the cycles about if they can make highs or lows and occur these situations.
ReplyDeleteI have done some graphics to explain it better if this is right
1: https://prnt.sc/pp4h9z
2: https://prnt.sc/pp4hgj
3: https://prnt.sc/pp4ho5
4: https://prnt.sc/pp4hv1
4: https://prnt.sc/pp4hv1
Delete1 - when the second 40w cycle moves below the low of the previous on it should continue lower, because the cycle of higher degree turned lower. It should not make higher highs again.
Delete2 - yes it should continue lower.
3 - the same like 1. most likely this 20w low is the important low 40w or what ever.
4 - only some special case pattern with higher low.... triangle
I remember.
ReplyDeleteSo what do you remember:) Obviously I have to ask when you post for second time.
Deletekrasi...so it seems like you are quite sure this time that we have a top right now at 3042...I really hope you are right....
ReplyDeleteThere is nothing sure until we see reversal pattern.
DeleteThere is almost finished pattern to the upside. It is corrective with divergences so the probability is high that we will see sell off.
Look at Nikkei, it is clear double zigzag from Dec lows. Looking like major top.
ReplyDeleteAgain I do not like this w-x-y story.... maybe it will work if the decline is in three waves,
DeleteAlternate scenarios:
ED - https://imgur.com/a/UfXWhvx
Corrective decline - https://imgur.com/a/s8zDv5u
krasi what do you think about uvxy at this price?
ReplyDeleteWe should see VIX spike soon(see the chart above) so it is time to buy UVXY.
DeleteIdeally VIX/UVXY should make one more lower low and reverse.
Thank you Krasi for your work. Have you seen the SP500 Dec'87 until Apr'88 ? 25% up in 4 months, then lateral 7/8 months. It is very similar to 2019.
ReplyDeletehttps://subefotos.com/ver/?294d7dc2a51c6628800fb785d535235bo.png
It is getting interesting SP500/VIX in the final v/5 wave and both just shy of the important trend line from the last two years connecting the highs/lows.
ReplyDeleteCan I ask SPY after already touching 3060? Could have any chance go turn down way? I still hoping to happen crush down to 2900,2870
ReplyDeleteNow there is finished pattern with divergences and very high probability for reversal.
DeleteJust to clarify, are you saying you think the high is in?
DeleteLooking the price action today one more high is more likely.
DeleteOk thanks
DeleteTVIX has now decayed enough where a c wave down to form a flat is possible without going over the recent trendline. in other words, TVIX can go up 50% and SPX test August lows without going over the TVIX trendline resistance.
ReplyDeleteI am relieved now:) This trend line must be broken for w4 from 2009 any way. It starts in 2011 and it is representative only for wave3. The next wave of the same degree should brake this trend line.
DeleteI still do not understand why should some one use trend line of derivative of derivative of derivative of the index instead of the index it self.
I can't tell if your being sarcastic. Name one other chart that correctly identify the bottom over the 8 years.
DeleteSorry, the intention was not to sound rude or sarcastic.
DeleteThe chart is the index itself, trend line connects the lows 2009-2011-2016-2018.<
yes but the index did not hit the trendline for the 2019 bottoms, which TVIX did. If you relied on index for that you would have to wait for <2700, already missed most of move
DeleteIs it possible 23th October started the last 2.5 week cycle to finish the 40 week cycle?
ReplyDeleteYes, it is possible.
DeleteYou say vix in v/5, I think this v/5 can be ED, now 4/v/5
ReplyDeleteNo... Or ED is finished or now is wave 2
DeleteMany analysis said the SPX could be bull till DEC.25th will reach higher around 3100-3400. And said From now on the SPY pull a little back the support at 301-300.
ReplyDeletewhat is your view on this support of SPY? Cause my position is short position, I need to stop loss for SOXS.
thank you so much for your analysis and reply me
Unless we have ED I do not see how this will gone a happen.
DeleteNow the pattern looks complete - https://imgur.com/a/I0q1eWo
ReplyDeleteThe impulse is questionable from the beginning, but both ways counting impulse or zig-zag the pattern looks complete with the expected Fibo measurements.
looks more like impulse, look at !rty
DeleteLook at SPX on a monthly chart... Megaphone?
ReplyDeleteAt the end when it i finished in 2020 it should look like megaphone.
DeleteOversold, drop next week?
ReplyDeleteIf you mean overbought, yes there is high probability.
Delete