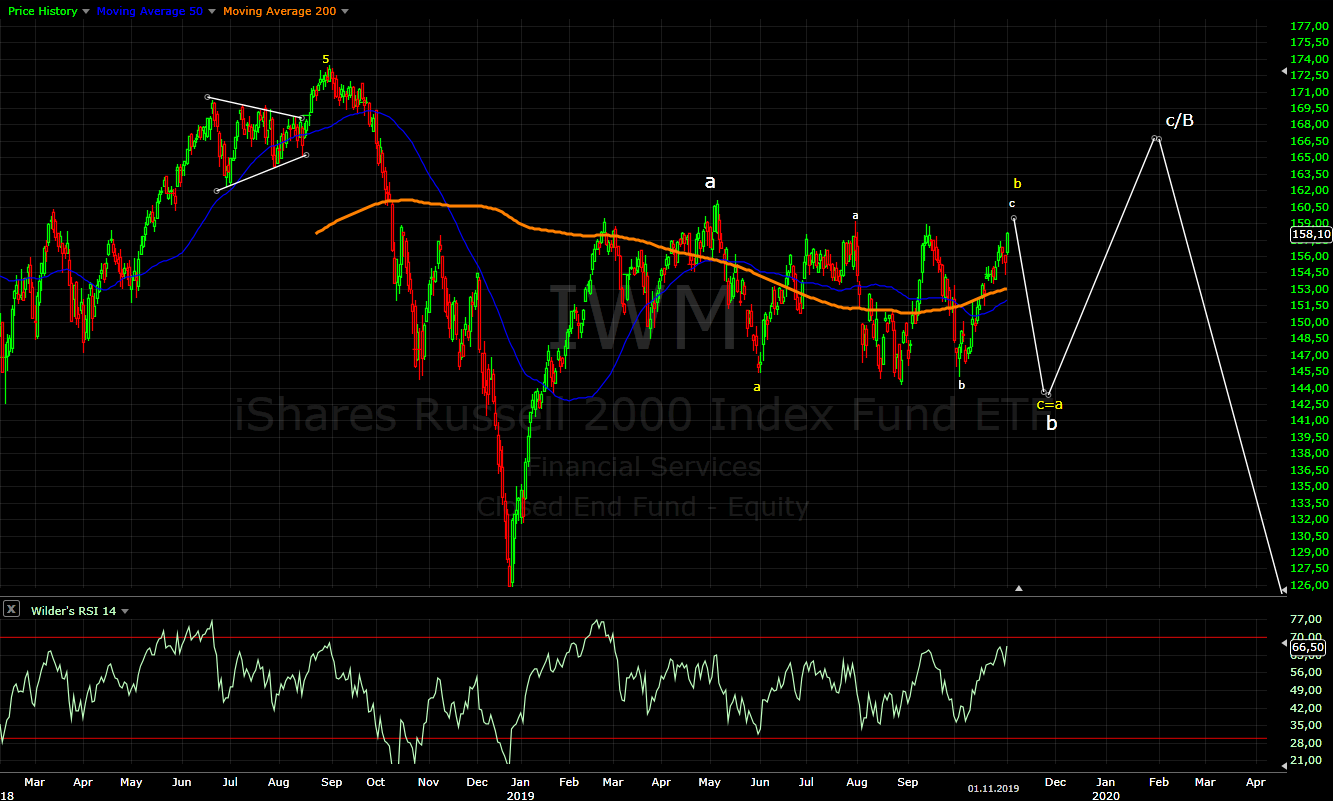
Short term - from August I see two legs higher with the same size so this is a-b-c for me.
If we have w4 this week the final w5 could extend another day or two next week. This count would be similar to RUT or XLF with normal size w3=1,618x1, on the other side NDX and DJI have too big declines in middle and in this case this should be the final v/5 - difficult to say which one.
MACD and RSI with divergences confirming that the fifth wave is running.

Intermediate term - I see completed a-b-c higher with divergences so next we should see move lower. The same pattern which I follow for weeks - corrective b wave and sell off to finish b/B .

Long term - at the moment I expect a correction to be finished in November. Then a rally for 3 months followed by final sell off to finish the correction which begun in 2018. There is too many alternate scenarios I will think about them if we did not see a sell off in November.

MARKET BREADTH INDICATORS
Market Breadth Indicators - are pointing higher, but showing weakness and divergences. Fear&Greed index showing extreme greed. The overall look is like for intermediate term high.
McClellan Oscillator - very weak with short term and intermediate term divergences.
McClellan Summation Index - buy signal, but with divergence.
Weekly Stochastic of the Summation Index - buy signal.
Bullish Percentage - pointing higher, but multiple divergences not confirming new ATH.
Percent of Stocks above MA50 - pointing higher, but multiple divergences not confirming new ATH.
Fear Indicator VIX - the impulse lower to around 12 to touch the trend line was completed, now we should see spike higher.
Advance-Decline Issues - weak, could not reach overbought reading, divergences - not confirming new ATH.
HURST CYCLES
The next few weeks should show at last where to place the important low. For 40 week cycle low we should see strong sell off lasting 2-3 weeks below the August lows.
Day 55 turn lower is overdue.

Week 22 expect sharp sell off for 2-3 weeks. If we have 40 week cycle low the price should move below the August lows. For 40 week cycle low in August and daily cycle low/10 week cycle low the price should stay above the August lows.

To continue from last week with another two indexes with different pattern, but sending the same message - the most likely scenario is sell off for b/B. Very choppy declines for RUT and DJT, difficult to imagine that this is reversal. The w-x-y top theory does not work either.
IWM(RUT) one more push next week for a high above the September high will look perfect.
DJT already reversed with impulse lower and bouncing from MA50.

About the daily cycles - I have seen a few times when a 20 week cycles have three shorter daily cycles instead of two. It is not conform to the theory, but this is what works.
ReplyDeleteIf the 40 week cycle is upon us I would say we have this rare case which deviates from the theory.
Instead of counting finished 40 week cycle or strange looking 40 week cycle or daily cycle with higher low(end of August) we can just count three daily cycles roughly 40 trading days.
And it looks like this - https://imgur.com/a/DRU31Jr
Maybe it is better to brake the rules some times, instead of looking for strange looking cycle phasing.
But then the 40 week cycle would last 50 weeks, is not too much ?
DeleteI know, but the other options are not any better and does not fit with the pattern and market breadth.
DeleteIf 24th october was 2.5 week cycle low, 31th 1.2 week cycle low. I think we can see the 40 week cycle low in 2-3 weeks
DeleteYes, it should last only a few weeks.... most likely three weeks.
DeleteI tend to agree. but my wav count might differ. https://imgur.com/a/RqGyy0K You could make the argument that the April top was just a, in that case the May to July rally would be an X wave as part of a B wave. Either way your are going to get a wxy correction someway, either the wxy is for the B in larger ABC or WXY for the whole structure since December. There are too many waves to count only abc since December.
ReplyDeleteMore often wave a is three waves so there is the right number of waves and it is more likely than w-x-y top.
Deletea is only 3 waves in a flat, if that were the case then the b wave should go down to 2500. Which is unlikely. Even if you think w-x-y is is rare, the market can still make it happen. It's better to accurately describe what is happening and go off that than go off what are odds.
DeleteIt's can be ED or wave E
ReplyDeleteWave D and then E to 2200
ReplyDeleteThere is no triangles...
Deletewaiting for 3300
ReplyDeleteThis is something else I was thinking about. Overall structure is a ABC zigzag and B is a triangle
ReplyDeletehere is the link https://imgur.com/a/fADmu11
ReplyDeleteW3
ReplyDelete3120, ED
ReplyDeleteI agree this might be possible, looks like ED we are in. If we get to that this month, than that would mean we are top of B wave since December.
DeleteDon't forget the QE4, it can't stop
ReplyDeleteI remember...
ReplyDelete...when you say, a long time ago.
Krasi, you were talking the other day that the vix was in v of 5, can you upload a chart with your current count?
ReplyDeleteNothing much to show - either VIX made it's low or ED is running w4 of it now so one final low.
DeleteKrasi what causes uvxy not to pop when vix is up
ReplyDeleteProbably the VIX short term futures are not so strong higher as VIX
DeleteKrasi, in a ED the wave 2 can be a ABC with the B strong?, I mean if wave b of 2 can exceed the high made by the wave 1
ReplyDeleteNo, wave 2 should never exceed wave 1.
DeleteHi Krasi! What's your opinion about DAX? Thanks!
ReplyDeleteThe same path, but I am wondering if wave B is already finished.... maybe lower high in January/February.
DeleteFor me b/b/B the same as SP500
DeleteI am starting to doubt that the US markets are b/b/B... and the European markets do not really fit too strong for too long more likely the top for the move from Dec.2018.
DeleteHi Krasi, are you beginning to doubt b/B based on overnight price action?
DeleteTime bothers me it is taking way too long... and now too high too. With every passing day it is getting less and less likely that 40w cycle has not occurred and if it is behind us we are in the middle of the next 20 week cycle(week 11 already) which should make a high soon.
Deleteseems like we have one more small leg up?
ReplyDeleteThis will be perfect, but so close to a high you never know it can just reverse.
DeleteI think that's a top, but of course stops are set! Ready to ride :)
DeleteI am still watching,there is no convincing pattern for reversal.
DeleteKrasi, don't you think it's w3 of w3 of w5?
ReplyDeleteNo, there is no 3 of 3.
DeleteIf not b/B next, what could it be?
ReplyDeleteThe top and decline. After that there will be again move higher, but deep retracement or test of the highs instead of impulse for c/B.
DeleteSo c/4 next in play?
ReplyDeleteYes c/4 or y/4 without clean pattern to finish the move from Dec.2018 the odds are rising that we have w-x-y from Jan.2018.
DeleteWhere would y/4 take us to?
ReplyDeleteI would say higher than c/4, but still testing the Dec.2018 low
DeleteThe 40 week cycle low could be 4th october instead of august? now week 5 of the 20 week cycle
ReplyDeleteI doubt it, it does not feel like 40w low.
Deletewww.youtube.com/watch?feature=youtu.be&v=Hl7L6CJz3EI
DeleteIt is taking too long, mostly likely we will see another high before reversal.... all this means 40w cycle low and b/B is behind us and currently 4/c/B is running.
ReplyDeleteSee the RUT and DJT, I was wrong:) the impulse is much bigger fits with c/B and not b/b/B.
I agree. It looks like this is the correct count. https://imgur.com/a/fADmu11. It is still in 3 or 4 of C, so could be a couple of more weeks before top
DeleteBut c/B is very small, 40 week cycle low in August?
DeleteI don't know how long C will last. For me this is still wave 3 of c. It could last all the way till End of the year.
DeleteI would say another 2-3 weeks for c/B to be finished and the end of the year will be lower high most likely ii/1/C around 3030 testing the old highs, which is now support later resistance.
DeleteI expect something like this for the top - https://imgur.com/a/BySZBLC
ReplyDeleteSP500 4h chart down to support 3030 for 4/c/B up to the trend line around 3115 for B to be finished
Mr. Krasi, it takes too long? Bottoms are violently fast, tops are annoyingly slow and take time to confirm (unless we see rare vertical move like a couple years ago)..just look at how many days the last few tops took...no different than this one. Why change your mind one day to the next? What signal changed your mind?
ReplyDeleteToo long refers to sharp reversal this week with sell off for b/B and 40w cycle low in November.
DeleteThis scenario is dead so adjusting the pattern and timing accordingly. All this does not change the big picture.
Thanks for your honest answer. May I follow up by asking what you mean by sharp reversal this week? the SPX closed at the high last Friday and followed through on that momentum with an extra 20pts on Mon and Tues, but failed to make a new high on Wednesday. Anyways, not saying we won't see another high just trying to understand logic...nothing changed in my opinion.
ReplyDeleteThe assumption until last week was we have a zig-zag higher from the August lows which fits with sell off to finish b/B and possible 40 week cycle low. For this we needed sharp sell off because the possible 40w cycle is too long already.
DeleteIt takes too long we do not have reversal so timing does not fit any more.
It is too strong for too long and does not fit the expected pattern which should be weak corrective wave b/b/B.
c/B is very very small only 300 pips, a/B was 600, I think it is not right
ReplyDeleteIn a corrective pattern there is one strong wave and one weak. There is no two strong waves.
DeleteObviously with crazy vertical move for wave a the other wave c should be weak. That is what we are seeing wedging, divergencies weak market breadth shorter wave....
For you, 40w cycle low the 15 or 28 of august?
DeleteMay be third of October:)
DeleteI mentioned in the current post that DJI and NDX look different.... it is difficult to count an impulse unless we are somewhere in the middle of iii of 3 and plenty of waves are missing or it is just not an impulse.
ReplyDeleteAt the moment DJ looks like two zig-zags so here one alternate pattern - https://imgur.com/a/bEW9ZUZ
The same path one more wave lower and higher, but bigger and longer in time.
In this case wave a b c will have the same length timewise roughly 4 months.
This will give a chance for the DAX/EEM to finish waves 4 and 5 to complete wave B with an impulse and not zig-zag.
Time fits well - 3 weeks lower will be nice half cycle low 8-9 weeks, higher 3-4 weeks for the holidays.
This pattern fits even better so I would watch it closely.
But the vix is in v of 5
DeleteThe VIX making higher low not confirming the new ATH this is the usual behavior.
DeleteThanks Krasi.
ReplyDeleteI still haven't given up on the original scenario, felt like lot of stops got cleared out in today's cash session... wouldn't be surprised to see reversal in coming days.
Which one? The more I watch this rally from October the more I think it is corrective.
DeleteIt is very unusual to see a top with corrective wave so this is my favorite count at the moment -
https://imgur.com/a/UHPUrGT
Yes that's the one. As usual the doubters are also starting to appear so keep the faith !
DeleteKeep up the good work Krasi. Ignore those random posts about how horrible this blog is.
It's a free world guys, and this blog is free... if u choose not to follow please exit without noise and try one of the paid sites instead.
I can't believe why some people are still following Krasi's horrible work. He's been dead wrong for a long long time now. I don't want to be rude but to be quite honest his track record is awful and pathetic, to put it midly. I strongly recommend investors to avoid this blog, there's nothing valuable here.
ReplyDeletethank you
I agree with you, I think EW analysis itself is wrong, lot of probabilites, extensions. This year EW failed to predict any upward or downward moves.
ReplyDeletePerfect now I am sure that the indexes are close to important top.
ReplyDeleteThe same clueless guys crawled out from their holes to explain me that I am wrong and EW doe not work:)
Thank you guys for being such accurate indicator for a top. You have perfect track record, but of course you will never learn:)
Do you remember Krasi???
ReplyDelete