Short term - wave 4 played out as a sideway move triangle lasting whole week followed by final burst higher. There is enough waves to count impulse for w5. Now waiting to see what happens next week. Brake below the trend line will confirm that the move from the October low is finished.

Intermediate term - the main scenario is important high w-x-y/B. The only way to extend the move higher is ED for c/B. This is the alternate scenario if we see only a zig-zag lower. In both cases next the indexes should test MA50 at least.
Impulse will mean reversal zig-zag more to he upside.
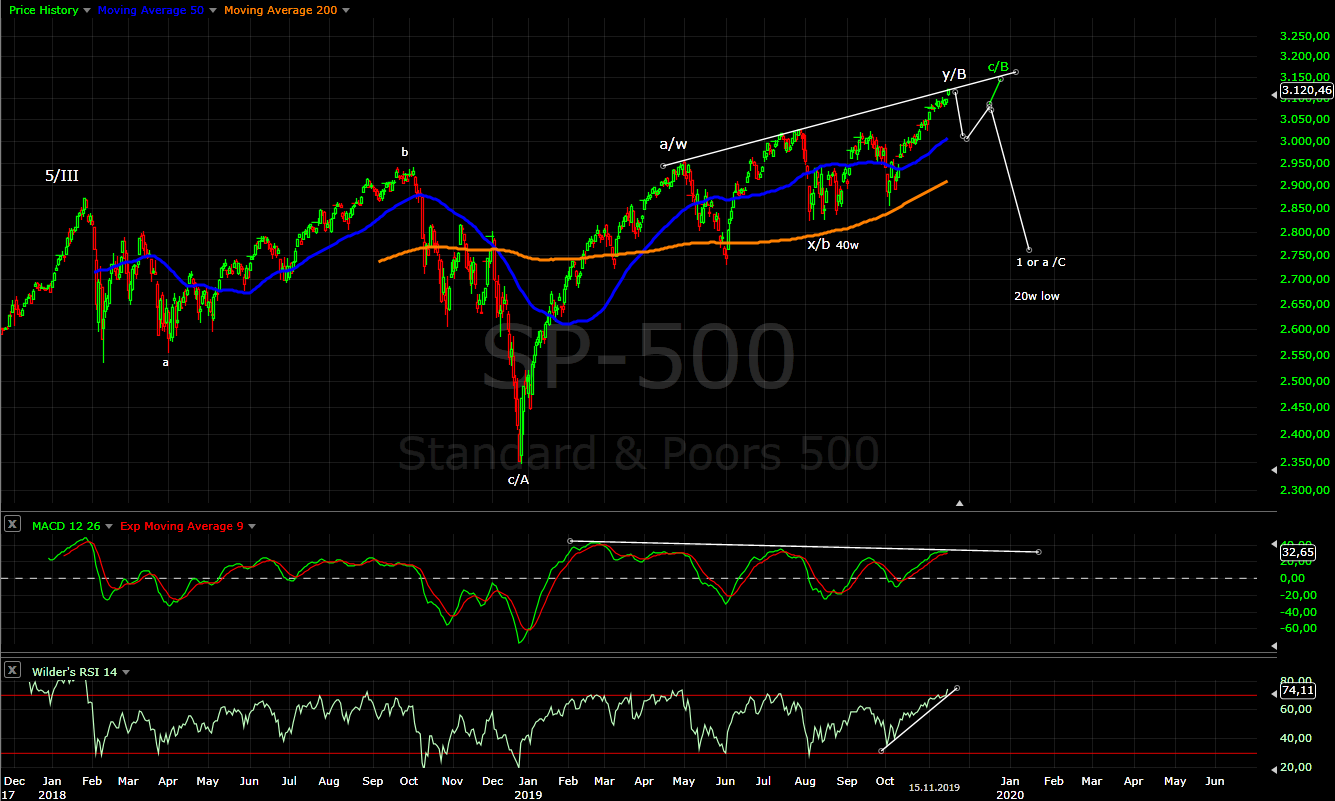
Long term - we are nearing the top of wave B and sell off into Q2.2020 should complete the correction which begun in January 2018. Alternate scenario a decline in three waves, but still a decline.
MACD and RSI - multiple divergences, third higher high with the indicators showing lower high.... smells like a top.

MARKET BREADTH INDICATORS
Market Breadth Indicators - the same... weak with multiple divergences.
McClellan Oscillator - below zero with multiple divergences despite the indexes "flying" higher.
McClellan Summation Index - multiple divergences, turned lower and sell signal.
Weekly Stochastic of the Summation Index - buy signal.
Bullish Percentage - scratching the overbought level with multiple divergences.
Percent of Stocks above MA50 - scratching the overbought level with multiple divergences.
Fear Indicator VIX - bottoming, next we should see spike higher.
Advance-Decline Issues - weak in the middle of the range.
HURST CYCLES
Day 58, something lower expected.

Week 12 for the 20 week cycle. After a 40w cycle low I was expecting 3 months higher - now we have this three months. We should see a top soon.

Tom Demark SEQUENTIAL AND COUNTDOWN - this technique spots areas of exhaustion.
Right on time for a high we have completed countdown. Early signal for reversal is price flip or close below 3080 at the moment.

profitable trade will be next year 3/C or c/Y what ever
ReplyDeleteWhen you say this, this will be a bounce from about 2750, back up to about 3000?
Something like that 62% retracement.
DeleteKrasi, your opinion about this:
ReplyDeletehttps://www.neowave.com/qow/qow-archive-1057.asp
Plenty of EW guys counting impulse.
DeleteKeep it simple 2000-2009 counts perfect as a-b-c, 2009- counts as impulse and most important trades great as impulse.
Someone has great theory that 6 fold rise for 14-15 years is not a bull market - nice I will pass.
Trading is not about smart theories it is about being profitable so I will keep it simple.
See you boys at 3200-3300-3477+
ReplyDeleteIt sounds familiar... wait I heard that twice in 2018, maybe third time's a charm:)
DeleteThird times a charm for what? The market is up 25% since Dec 2018. Third time to keep making ridiculous money while EW keeps looking down? I'm cool with that. When the market says it's time to sell I will sell.
DeleteI think we are 2-3% away from the top. No 1h or 4h divergences yet, indices are moving in a clear channels. Aaaand I believe we have to hit 110 USDJPY from below. EEM has already topped, I'm waiting for lower high ~44 while US tops- this is typical behaviour.
ReplyDeletehttps://imgur.com/VoBE8lb
https://imgur.com/hmSVB1B
https://imgur.com/cW9ooo1
I would say more likely topping and another 0,5%-1% higher.
DeleteThere is divergences on 1h/4h and 2-3% higher will destroy them.
Here we have Krasi calling for a top once again. Even a broken clock is right twice a year. To be quite honest Krasi's performance has been horrific and pathetic, borderline disgusting. I'm betting Krasi will be proven wrong once again this week and that the market will continue to make new highs. EW theory doesn't work in the real world, it's a waste of time and a distraction.
ReplyDeleteIn my country you would most likely be in jail for posting such garbage.
Emotionally unstable persons going nuts again:)
DeleteI do not care, the market does not care and it will just go down no matter how angry you are.
User VB remind me, maybe two months ago, that for a top we should see the trolls again.
ReplyDeleteThis time are more "angry guys" than trolls but they showed up in the last few weeks and it is escalating every week.
We are definitely close to important top - they are hugely invested emotionally which means they are all in, my forecast hurts them emotionally and they feel the need to "hurt" me.
This is how emotions work, I have been there:) This is the worst you can do - let your emotions control you.
The pattern is running for two years and it will continue to do so. The market does not care about your emotions.
By the way all the emotions from the guys above resemble the five stages of grief:
- denial - see you at XXX
- anger - I must be in jail:)))
- bargain - When the market says it's time to sell I will sell.
The problem is depression follows....
Denial - you keep looking down and have missed many epic runs. My God the money you have lost. You are in denial.
ReplyDeleteAnger- you clearly get mad when anyone disagrees with your constant top calling.
Bargain- smart people are up 25% on this last epic run. When the market starts to turn they will sell. Maybe lose 5% but they made 20% while you still look down. Then you buy in cheap and do it all over again. How hard is that to understand?
Your analysis is already in depression. Your emotions are showing. Stop fighting the market. 25 % is an awesome return and no crystal ball was needed.
The trolls with their selective memory:)
DeleteOne way to get rid of them is not let anonymous accounts post on here. I think that would be addition by subtraction.
DeleteI can delete them any time or post after approval, but they do not bother me and they are lot of fun:) Nice indicator for important high.
DeleteYour daily cycle is lasting too long. Is it not more possible that it finished the 4 of October with 35 days and the next one will be in mid-December and it will be also the 20 week cycle low?
ReplyDeleteThis is way too fast. I would rather count a low in October than this.... although this much higher low with strength on the DAX looks ridiculous for 40w low.
DeleteThe cycles are not symmetrical and not following perfect the theory. The next wave lower is coming and if it makes a low in January we have 20w low. If the low stretches in February we have to make it fit with 40w low in October with higher low.
Lol, everyone's here so looks like it is time to use 3x short!
ReplyDeleteThe blog has gotten quite entertaining this week. :)
There are some blaming Krasi for not predicting this continued upside. You really need to take ownership of your trades. If Krasi could predict all the moves rightly, he wouldn't be here!$!$
We all have been waiting for a larger move in one of the directions.. looks like its game on now!
Krasi - You mentioned that you enter a trade after a confirmation of the direction. Isn't that too late? Don't most people enter a trade after a pattern is complete?
ReplyDeleteIn the current situation, what is confirmation that SP500 is headed down? Test and break of MA50?
I use this two charts below for an entry. It is an early entry, but highly effective with low risk.... they are tracking the so called daily cycle which I am talking about. Sometimes it is the same like the 80day Hurst cycle sometimes not. It is not part of the theory, but this is the tradable cycle so I do not care about the theory.
DeleteWhen the price close below MA10 confirms that the cycle reversed. You can refine with impulse lower and corrective retracement on the hourly chart.
https://stockcharts.com/h-sc/ui?s=%24SPX&p=D&yr=0&mn=6&dy=0&id=p19689966542
MCO MA5 track pretty good this daily cycle. When it turns lower/higher it does not last long before the price follows. When it turns draw a trend line on the chart and when the price breaks this trend line the cycle reversed and there is no going back.
https://stockcharts.com/h-sc/ui?s=%21MCOSIRSPX&p=D&yr=1&mn=6&dy=0&id=p69281250624
Now all this are triggers, you do not make a decision based on them. Decision to go long/short is made looking the big picture - the overall EW pattern and where currently the price is in this pattern, cycles where exactly beginning/middle/mature, indicators, market breadth.
For example when the trend is higher and there is no signs for danger you do not short, you are waiting for this daily cycle to make a low and you are buying no point to short.
I have one more entry - when I see with high conviction completed pattern this is risky trying to nail tops/bottoms and this is always with small position like 1/3. Some will say ridiculous, but I see exactly this now. Probably I will enter short today...
The current interpretation of the charts - way above MA10 and MA50. Usually in this case you do not see sudden reversal there should be at least one significant bounce and opportunity for an entry.
In the case of an impulse we should see first lower to the congestion area and MA10 3075-3100 and corrective bounce - see the explanation for the first chart.
Then lower to MA50 with an impulse for i/1/C and bounce in December for ii/1/C second opportunity for an entry.
The surprise is corrective decline - than the sell of will be steeper down to MA200. In this case I expect short living bounce from MA50 and bigger bounce from MA200 and final sell off into January.
My plan is 1/3 today, 1/3 below MA10 and 1/3 after a bounce from MA50 all this riding until 20w low in January. If something goes wrong the loses are small - 1/3 of what you can live with:)
Thanks Krasi for a detailed response. I will spend time on it to fully understand it. Blagodarya!
DeleteTechnical analysis no longer effective, central banking and algorithm manipulation have assured. Learn to sell premium or don't trade
ReplyDeleteNot even close TA works perfectly fine and nothing has changed. The same as before - there is some which can analyze charts and majority which can not.
DeleteCBs do not control anything just amplifying the moves in both directions.
It is a flat for w4(first chart) that is why one more high - https://imgur.com/a/ywbYlLZ
ReplyDeleteLook at the DAX daily+RSI and the 10min chart everything is synchronized now.
Look crude oil, reversal since yesterday?, price below ema10
DeleteIt could be, but too much mess so must wait a little bit to be sure. Watch RSI and its trend line on the daily chart. At the moment it is exactly at the trend line. We need to see continuation lower today and RSI breaking below the trend line, which is usually confirmation that the current trend has reversed.
DeleteIt can still surprise with final leg higher to complete w-x-y pattern and this is b/y with one more c/y higher.
I do not like such risky setups.... I prefer to wait in this case.
I believe as lara say, w3 of w5, then A huge ABC for super cycle
ReplyDeleteIt is obvious that you made a decision and it is to ignore the chart so it is useless to explain why it is wrong.
DeleteSo why it's go up and up and don't stop
ReplyDeleteSimple c/B has to be completed now for the first time we have full set of waves. How about the Fibo extensions for expanded flat?
DeleteHow 30-50 points higher change the pattern running for 2 years? - they do not, it is corrective.
Instead of wasting time with Lara, which can not count waves, why do not you use the time to look at another indexes? Look at DAX,NIKK,NYSE,RUT,DJT,XLF the list is long and come back to tell me where is the impulse. Wait SP500 will decouple and run in 3 of 3 next year while the rest of the world will decline into 4 year cycle low after corrective pattern.
NDX with different pattern, but the same message - https://imgur.com/a/bPKXTYe
ReplyDeleteSome corrective garbage for ED either 3 or 5 already.
DAX looks like a failed breakout from rectangle.
DeleteThe problem is the QE, they print more and more
ReplyDeleteFull circle and back again - "It is obvious that you made a decision and it is to ignore the chart so it is useless to explain why it is wrong."
DeleteIn the charts is everything priced in. I do not care about QE, FED or Santa Claus.
Thanks Krasi for your work,charts and patience. I support you and thanks to your analysis i study every day the market.
ReplyDeleteHello Krasi,i ask your view about the Dax: if we are nearing the top of wave B and sell off into Q2.2020 should complete the correction which begun in January 2018 and bring the S&P500 around 2200 what is the final target of the Dax? Thank for you answer.
ReplyDeleteIt looks like classical flat correction so target is the Dec.2018 low or slightly lower 10k is nice round number:)
Deletehttps://imgur.com/a/ywbYlLZ seems to be invalidated now given we are down at 3106, is that correct or is v/5 still on to confirm the top?
ReplyDeleteThis was just short term chart and this 5 is done. Now watching how the move lower will develop .
DeleteI see completed patterns everywhere and the move from the October low should be already finished.
I am short with 1/3 position from yesterday and watching if reversal will be confirmed or not.
Thanks Krasi - good luck with the trade
ReplyDeleteWhy dont you like the 20 week cycle low in december?, it will be around 19 weeks
ReplyDeleteBecause the probability to see 300+ plunge in the next 6 weeks is low.
DeleteI was thinking in c of b of B for december
Deleteb of B is history already...
DeleteSorry Krasi, I disagree, only in wave 4 of c still needwave 5, wave 5 could be extended. Could last all of December.
ReplyDeleteSorry no more extensions. I am not sure if we have an impulse in the first place.
DeleteFifth wave extension is 1-1,6 from 1to3 if this happens this will not be c/B in the first place.
If I understand according your count we saw w3 top and now w4 running.
Maybe but w5 could not be extended because w3 is already extended close to 2,618 Fibo level. It should be roughly the same size like w1.
Look at closely SPX NDX and DJI(this is the hint) - two legs higher with the same size classical a-b-c with zig-zag for a and impulse for c. For DJ you can not count an impulse unless it is not cmplete and we are still somewhere in iii of 3. I am watching this zig-zag from the beginning and I am wondering why am I running with the herd and count an impulse....
Actually, I'm not sure we are in wave 4, maybe still wave 3. If we drop 80 points i wave 4, the last rise up could be slow and grinding even if it is not extended. My point is look for Market to continue to top until the end of theyear.
Deletew3 is done if there is 3 at all - check RSI.
DeleteOne more high is possible similar to the July top.... lasting weeks is questionable.
And when I speak about corrective leg from the October low this will be real fun - https://imgur.com/a/rlUb15c
ReplyDeleteExpanding ED for c/B:) this pattern is like city legend - everybody knows it, but no one have seen it:) At least I have never seen it, so it will be really fun if this is the top.
Dax has broken the trend line from October in rsi, a last lower high with divergences?
ReplyDeleteIt will look good... for the US indexes too. There is no convincing reversal so far.
DeleteOn the other side RSI on the 4h chart says the move should be over....
Nailing tops is difficult, that is why I build position in small pieces.
Yesterday 10 week cycle low ?
ReplyDeleteYes, according to my phasing the mid cycle decline should be running and no we should see a few more days lower.
DeleteWhat is the mid cycle?
DeleteThe middle of the 20 week cycle or the 10 weeks from the question above.
DeleteDoes it mean going up a few days without exceeding the last high?
DeleteThis "up" is running in the last days and it is visible on the hourly chart.
DeleteDo you expect new highs next days ?, I think a last high is possible to make divergences
DeleteIf the next decline stays above 3075 for a-b-c than yes.
Delete