Short term - at first it looks like impulse, but I do not see such for the other indexes or the futures. I think it is a-b or some ED running. Again as long as it stays above 3300 we should see move higher, for something bearish we should see acceleration below that level.

NYSE again with more clear picture, many indexes have this zig-zag up/zig-zag down pattern. For a top I want to see NYSE making higher high to synchronize with DJ/SP500... it does not make sense if they have different patterns.

Intermediate term - the indicators do not look so good. Waiting for the move up to be completed after that expect MA200 to be tested.
In arithmetic scale after one more high we will have two legs up with roughly the same size.... zig-zag corrective pattern.
Below DJ and RUT how I see a complete pattern. It is the same for SP500 just this indexes show it more clear. The outcome for the both patterns is the same it is just the labeling and they will hit the high at the ideal cycle time for a top.

DJ with ED for c/y/B.

RUT with series of zig-zags including all four a and c waves.
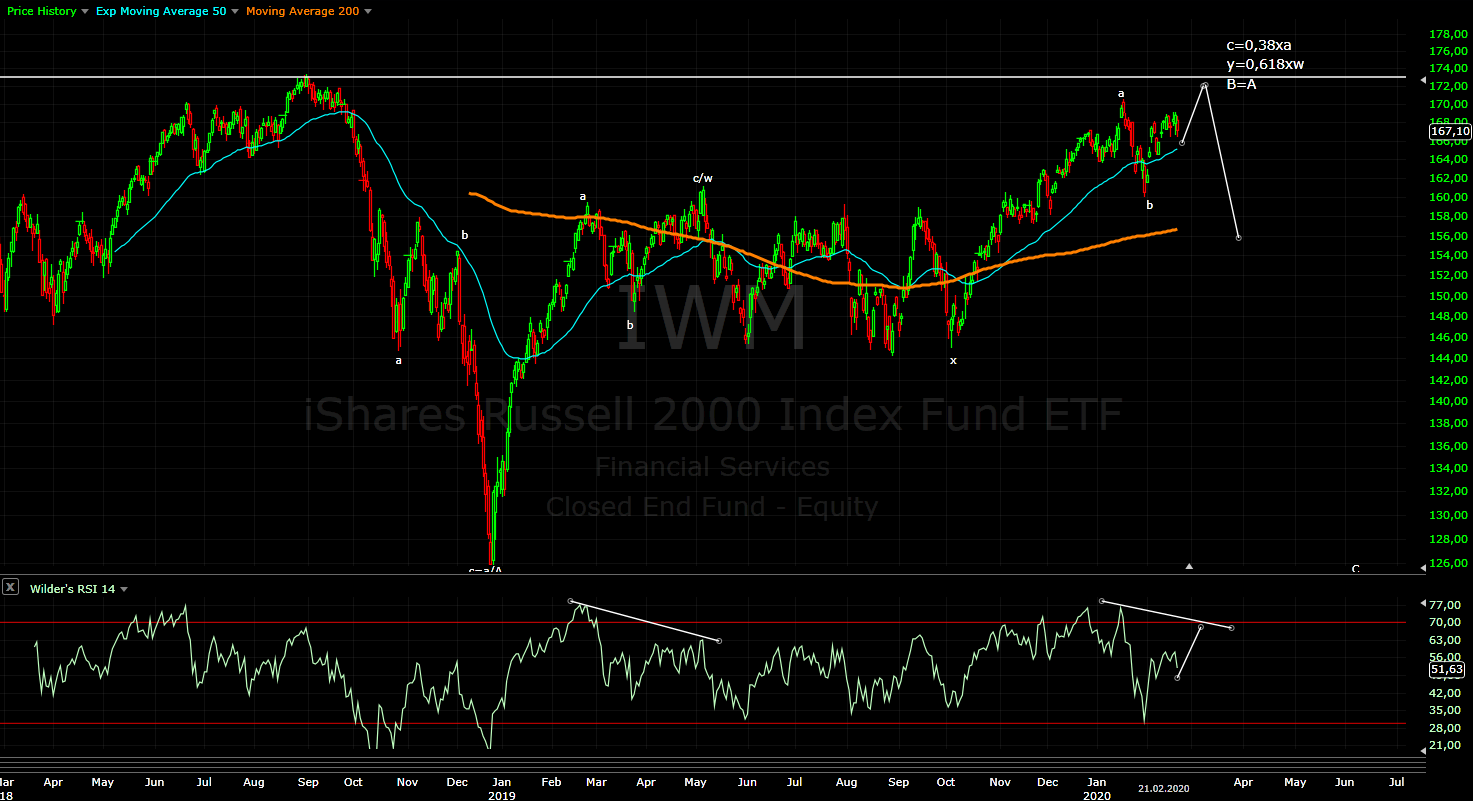
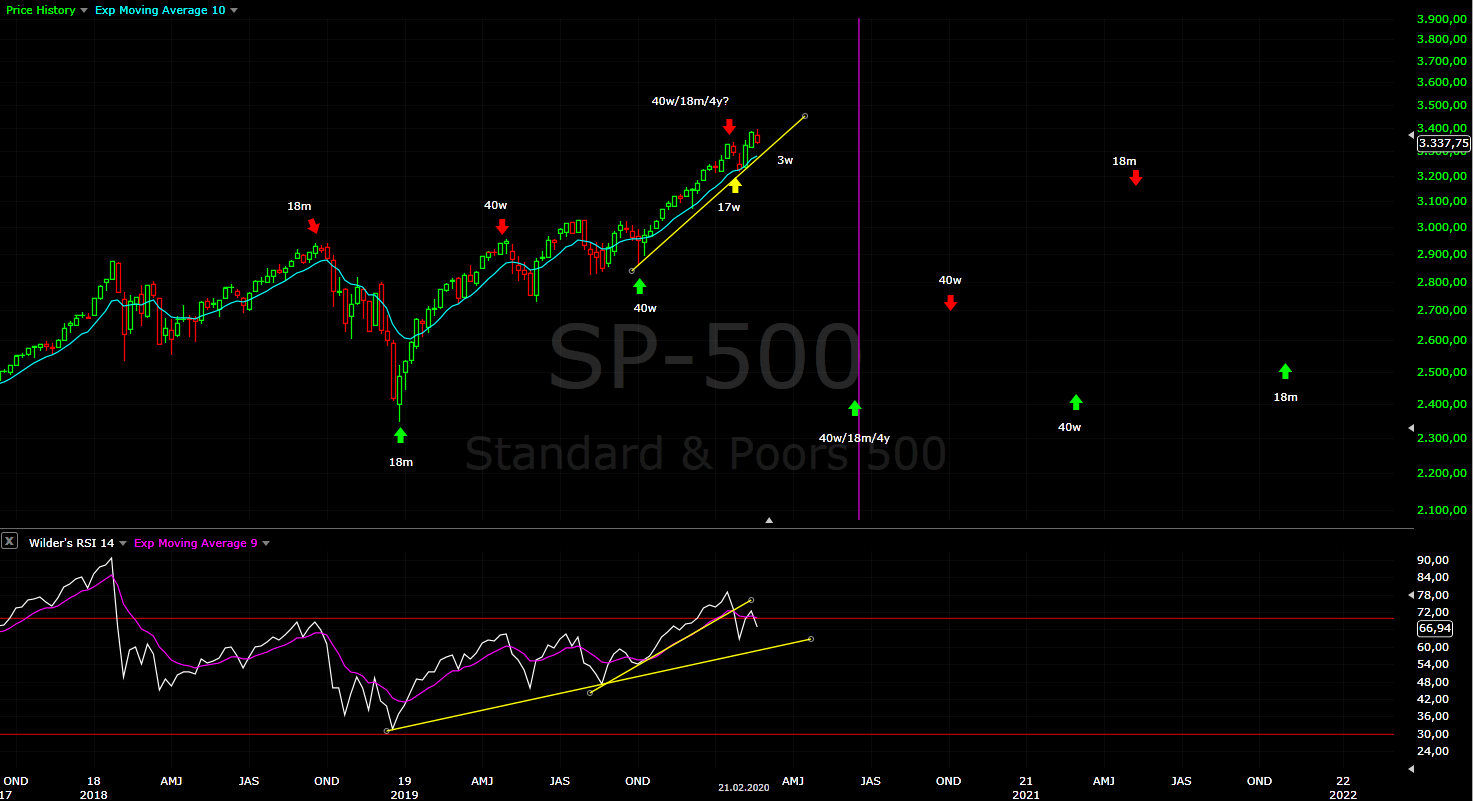
Long term - close to the top of wave B, once completed we should see sell off into the end of Q2.2020. It will complete the correction which begun in January 2018. Alternate scenario shorter impulse C for running flat, less likely zig-zag lower w2 for a big ED.

MARKET BREADTH INDICATORS
Market Breadth Indicators - the same weak with divergences, pointing lower and sell signals.
McClellan Oscillator - below zero, divergences.
McClellan Summation Index - sell signal with divergences.
Weekly Stochastic of the Summation Index - sell signal.
Bullish Percentage - divergence, turned lower.
Percent of Stocks above MA50 - below 75, pointing lower with divergence.
Fear Indicator VIX - series of higher lows, the next big move is spike higher most likely in March.
Advance-Decline Issues - turned lower with double divergence.
HURST CYCLES
Daily(trading) cycle - roughly 1/3 of the cycle. Sell signal was triggered - the price is below MA10, RSI below MA18, the price broke the trend line. As expected this cycle is weaker than the previous two.
At the moment I am ignoring the signal and giving preference to EW+cycles. I could be wrong, but I want to see either completed pattern or reversal pattern and there is no such at the moment.

Hurst cycles - the first two cycles look perfect 15 days high-to-high for the 20d cycle and lower, now we have day 15 low-to-low for possible 20d cycle low(not confirmed yet). Why is the first week of March interesting for a top:
From high-to-high perspective I am expecting to see 5w high before the markets turn lower. This is 2x20d cycles or the first week of March.
From low-to-low perspective we have new 20w cycle running so I think the minimum is one 20d cycle higher(check) then the second 20d cycle should "fail" and revers around the middle of the cycle or before that - another 6-8 trading days higher is again the first week of March.

Week 3 for the 20w cycle. Weaker as expected - DJ,NYSE,RUT are struggling below the previous high, SP500 around it. It is all about the tech stocks - many of them completing w3 from 2009 and many with vertical moves. We should see spectacular decline into the 4y cycle low because first it is compressed in time and second it follows vertical patterns.... and they always end the same way - vertically lower.
If this is wave IV it cannot be running flat as you suggest in long term chart. Wave II was running flat so the rule of alternation eliminates that possibility in wave IV.
ReplyDeleteThere is no proper wave II in the first place... nor III.
DeleteThere is zig-zags. I do not know if this is right or wrong - https://imgur.com/a/0bS6mp2
but it counts naturally and this cycle seems to run very good from 2000.
What cycle is this?
DeleteIt is roughly 3.5 years long, it is not standard Hurst cycle. It is not standard EW impulse either. Some make difference between motive(sub-waves with 5 waves) and simple(no need to have sub-waves with 5 waves) impulse.
DeleteThe logic for such scenario is how vertical moves play out. Plenty of shares and some indexes with vertical moves - what follows usually is sharp but short living decline(the 3-4 months into June) and final rally higher(mid 2021 the next 18 month cycle high) and the bubble is over.
In the last 2-3 months the tech stocks gone crazy and after vertical pattern expecting another 3-4 years higher does not make much sense anymore... so watching this as alternative.
For now it is just a theory plenty of time until mid-2021.
Closing my long puts here 3270ish... Will be worth nothing if bounces month end expiry. Made back what it had given up last 10 days, pretty much scratch ..
ReplyDeleteCan't time this reversal !!!
Most of the time a reversal can not be timed. This is the wrong question - how to time it. The right question is how to squeeze the best price with lower risk around reversal:)
DeleteSo what do you suggest now, after this move ? How would you position?
ReplyDeleteIt is always the same - wait for confirmation impulse lower and corrective retracement https://invst.ly/py1f0
DeleteCorrective move higher is the entry point with stop the above the last high.
The problem is sometimes there is no sizable retracements.
Those who are confident enough, can use several entries to build position and start before we see confirmation.
Gap lower and acceleration below support, impulse is not completed yet, but it looks like reversal to me.
ReplyDeleteWatching this at the moment - https://invst.ly/py1f0
It looks like H&S with the right shoulder which should test MA200 and the gap, and timing is this 5w cycle high discussed above.
The bulls will see expanded flat for iv/3, as you know I think this is wrong.
Look at how the monthly time frame plays out - January higher euphoria and the last day hammered down, February higher and euphoria and the last week hammered down. Two bearish monthly candles in a row - do you get it what is going on? It is called topping.
Most will ignore it of course, March will start higher a week or two... nothing happened right. I guess March will end like January and February hammered down.
"March will end like Jan and Feb, hammered down" .. Please elaborate since spot price is sequentially higher every month.
DeleteI follow and respect your blog man, but this time you didn't get the turn at all...
Open a monthly chart and look at the last two candles - if you think everything is fine because the spot price is sequentially higher(which is not true January is a red candle) than I can not help you. Read a book about candlesticks.... or just use simple logic.
DeleteThe months are starting higher and end awful - this is topping and distribution, printing very bearish candles which is reversal sign.
Draw trend lines from Dec 2018 - clear wedge and upward break out was rejected twice.
March will start higher, hurray again just to see for the third time the month closing with awful candle.
Well when the indexes turned higher in February I wrote it is just double top, the 20w cycles with M pattern - and everybody were laughing, it makes sequentially higher high every month, right:)
I got it long time ago that I can not nail the turns and I do not try it. That is not the goal, the goal is trading.
I wrote clear ugly daily and weekly candles with sell signal. I wrote I will ignore it. Why? simple I have already 1/3 short position. For another entry I have to see either clear and convincing pattern(did not happen) or confirmed reversal - waiting for this one coming first half of March.
Thanks for patiently explaining.
DeleteDon't forget to share the confirmed reversal too in early March when that happens ..
Is it possible this move down is the 20w cycle low of 21 weeks?
ReplyDeleteEverything is possible... if we see another 3-4 weeks higher.
DeleteHi Krasi, what is the reason for bonds to melt up in this situation? Do they shoot up due to higher demand for safer (are they?) assets?
ReplyDeleteMy reason is always the same pattern+cycles. Look at the long term update - 4 year cycle high should be completed. I am not really interested how the newspapers will justify it.
DeleteMost likely fear and flight to safety.
Good answer, timing is matching perfectly with what you called out in the long term update.
DeleteThough if current support level breaks on some of the yield charts (US10Y for example at ~1.35), there is no support below this level. So it will be interesting to watch over the next few months.
Krasi tvix target your thoughts
ReplyDeleteI think another 6-7% higher then the gap and MA50 around 50 should be tested.
DeleteSo your looking for about 65 then down
ReplyDeleteYes, something like that 65-67 then lower and another leg higher in March.
DeleteNice call this week , Krasi
ReplyDeleteKrasi, can you count impulse?
ReplyDeleteOne more wave 5 is needed. Looking the indicators and cycles there is more to the downside even if it is with three waves.
DeleteNow we have the lower low and the pattern looks like impulse
DeleteKrasi good call tvix to 67 what's next 52 your thoughts
ReplyDeleteGap fill looks a good target.
DeleteCorrective move is coming and it is difficult to predict exactly how deep and for how long.
Es just hit fib 61.8% retrace
ReplyDeletewhere are the trolls, Krasi
ReplyDeletePraying for the FED to print money....
DeleteDo you see more likely 20w cycle low today than 3 weeks ago?
ReplyDeleteUnless we see 100+ points rally in the next three days - No. If this is the 20w low the next one should make higher high. Now we have impulse lower, which means more to the downside and not to the upside.
DeleteYou have to count expanded flat for wave iv/3 to fit it somehow, but this is not the way such wave should behave - printing two bearish monthly candles.
This looks like textbook impulse to me - https://invst.ly/pymte
ReplyDeleteFor those with the "right count" look at DJ and NYSE, you can kiss your third wave goodbye:)
ReplyDeleteJust an abc correction, nothing to worry about ;)
ReplyDeleteDo you still think we have 1 more higher high?
ReplyDeleteNo, on Monday was clear that it is over.
DeleteAt this pace, it looks like SPX is headed straight to 200DMA. Right, Krasi?
ReplyDeleteYes, this is the good news for the bulls:)
DeletePeople gave you a very hard time over the last few weeks. Today we know who is right!
DeleteAll this has been great learning, thank you very much for the open discussion!
I agree.. thanks krasi
DeleteThis is how emotions and herd mentality works... refusing to see the market for what it is. Amazing is that even "experts" with a lot of experience joined the herd.
DeleteI have made mistakes too - timing was the problem. I learned my lesson and changed my cycle analysis. I think in the future it will work better.
The problem is everyone has been saying we should go down to 3000-3100 level. My question is what happens next? Sounds like some think we go to 3700 which I guess means we were in 3 the whole time??
DeleteSee below, answered the same question.
DeleteYes indeed, the timing tested us all. Thanks for acknowledging Krasi.
DeleteHappy trading!
Isn't it too fast?
ReplyDeletethe last 20 week cycle and the 4 year cycle for May June but if this is already 1 of C the next month the C has finished
It is too big for i/1/C this is the good news for the bulls mentioned above.
DeleteIt is fast, but it is not a problem to be 1/C, w4 could easily consume 3-4 weeks. But this C wave is the alternate for running flat with higher low because w1 is not big enough.
The other options it could be wave a as part of zig-zag move lower.
I know a lot of people were saying 3 would end in the 3300 area (which appears correct). Then down to 3000-3100 then up to 3700. At what point do you think this could be correct? If we break back over 3200?
ReplyDeleteThe impulse is dead, it never existed in the first place. This is not w4.
DeleteThe cycles are clear down into June.
The weekly and monthly time frame are turning lower this is not 2 day wonder like the three correction from mid-2019. It is already bigger than this three moves
Nice. Just making sure before I short. Thank u.
DeleteBare in mind for this move lower 2/3 is already behind us. The next big one will begin in April.
DeleteOK, reason I asked was in Dec 2018 I didn't get in the market cause Avi and all the EW people were saying to wait for the second drop then go long. I missed out on an epic 2019 run. I'm not buy and hold. I would hate for this to go up to 3700 and miss out again. Guess I will wait until after April.
DeleteCurrent thoughts:
ReplyDelete- market breadth oversold, most likely scenario bounce higher and another leg lower with divergences.
- trading cycle day 16 - usually it runs 35-45 days. Given the speed it should be from the shorter one 30-35 days. Too far from MA10 and RSI vertical lower so most likely bounce higher to test MA10/MA50 and another leg lower.
The pattern:
- best fit is a/W and the whole move lower develops as a big double zig-zag. Look at October.2018 as example for this W wave. Then X several weeks retracement and 10w cycle high and Y lower.
- less likely i/1/C - this two day move is big and the market has to crash for several weeks and this just for the beginning 1/C.
- the last option 1/C - it does not fit well now we should see 3-4 weeks higher when a few weeks lower are expected.
Trading - there is more to the downside corrective move higher testing MA10/MA50 is a sell.
Pullback to ema10 and sma50 daily?, shorts from there?
DeleteThe bounce now can test MA10, MA50 unlikely. See the chart below.
DeleteMA50 should be tested later with the bounce of higher degree 2/C or what ever it is.
But sma10 or ema10? and in daily?
DeleteDaily, for such short period is not important SMA or EMA. Test does not mean it should be touched exactly. It means more this huge gap between price and MA should be closed somehow.
DeleteOr i is extended wave in 1/C this will do the job too. To summarize we should see more to the downside to complete zigzag or 1/C and 40 day cycle low around mid-March - https://invst.ly/pyxl9
ReplyDeletein a congested a-b-c , which may peak tomorrow and then retest the futures low friday
ReplyDeleteSo what if this goes to new highs? Serious question. What would the count be?
ReplyDeleteYou have to count expanded flat for w4 then w5.
DeleteW5
ReplyDeletePrinting up up no correction... why bother watching the charts
DeleteHi Krasi, do you think oil is headed to $40-42 range or you think lower like you showed in the long term chart?
ReplyDeleteI think a-b-c from the last high is completing. Now we should see a-b-c higher before continuing lower for the target shown on the long term chart.
DeleteThis last move lower consists of two zig-zags with the same size and it is 38% from the previous one.
It is more likely to see a bottom instead of acceleration in a third wave.
I see this at the moment extended first wave and impulse like this - https://invst.ly/pz960
ReplyDeleteThe next week 5w cycle low ?
ReplyDeleteCounting weeks yes, but counting days it should be the second week of March.
DeleteThis is my cycles count, I know you think that it is wrong but it is a possibility, the 4 years high will be with 2 of C or with x of W
ReplyDeletehttps://prnt.sc/r8i747
The 4 years high is not necessary that it makes higher high. It can be a lower high around 3200-3300
DeleteThis is not serious the market said it loud and clear we have a top.
DeleteI don't believe the market go straight down I think you will have a mass of your cover rally at some point just my opinion
DeleteYes there will be strong rally retracing at least 50% likely 62%. It will not go down in a straight line, but when I hear some believing that somehow we will see a turn and new ATHs.... it will not happen.
Deleteshort term bottom? 300 seeming to hold on spy
ReplyDeleteOn the daily chart support level, trend line, MA200 and 38% retracement were hit.... this is my target for the first leg lower. Lets see if this cluster of support holds.
DeleteThe low will be tested for sure.
Are you referring to today's low or Dec18 low?
DeleteThe low today.
DeleteThis decline is really crazy.... relentless.
I knew the decline will be spectacular and the sheeple will be punished badly, but this..... The market is punishing greed ans stupidity always but this is really cruel. Wiping out half of the returns in 4 days.
Curious what the smart long term investors will say now?
they will say
DeleteGreat time to buy starter position
Or
Dont worry just average cost down
Dow has dropped 50% from its low in dec 2018. This suggests that expanding triangle is being printed.. Jan 2018 - today. This means 3 waves only. Big rebound now to 3300 on snp 500 and then 1000 drop in wave 3. What do you think Krasi?
ReplyDeleteI am not big fan of expanding triangles ED etc.
DeleteSince you like to look at all indices, I thought I will ask this question. SPX seems to have reached 200MA and is at critical support. Though it feels like NDX and in general the tech stocks need to retrace further to reach 38% retracement and 200MA. What are your thoughts?
ReplyDeleteImportant is all indexes should print impulse lower including NDX. Looking the features it already touched MA200 so the minimum is satisfied for me.
DeleteOk. I thought 200MA is still 150-170 points away so wasn't sure.
DeleteTime to cover short, retracement bounce
ReplyDeleteYes, this move lower is crazy keeps extending, but I would say it is time to take profits. At least half of it is not a bad idea.
DeleteAlso yields keep falling like crazy as well. Do you still think we are close to top on bonds?
ReplyDeleteRight on schedule, divergence on the weekly chart - I do not see a reason that something else will happen.
DeleteDo not forget after the summer we should see inflation accelerating and yields will follow.
Hello Krasi,instead about Natural Gas do you think It Is time for an entry for the coming upside?
ReplyDeleteI do not see signs for a bottom. I would not try to guess the bottom.
Deletehttps://www.tradingview.com/x/lFpVpRQ9/
ReplyDeleteThis is the alternate scenario.
DeleteAnd the S&P 500 suffered its fastest peak-to-correction plunge ever
DeleteThe 4 years low end of year? very late
Delete
ReplyDeletevolume profile, support area of strong volumes https://www.tradingview.com/x/ircdyj8l/
Krasi, Is SPX headed straight to 200WMA? :(
ReplyDeleteIt smells like a bottom today
DeleteKrasi, curious I know u were 1/3 short early like me early and took pain. Did you size up at any point this week, any confirmation ?
ReplyDeleteI didn't manage to grow the short, covering today and playing long for retracement bounce
No, many times it looked ready for a bounce and than just gap lower....
DeleteThe same with me taking profits and that is all. It is not so bad after all.
qqq hit the 200 day, tech should save it IMO
ReplyDeleteTech stocks look good they count better as corrective zig-zag as it should be.
DeleteI'm short big size uvxy
ReplyDeleteKrasi uvxy what's your opinion 15 coming thanks
ReplyDeleteI will not be surprised to see 15.
Deletehope we are right i shorted 26 25 24 22 crazy
Deletei shorted so much uvxy that the broker called me up to see if i was insane lol
ReplyDeleteWith VIX hitting almost 50 this should be very good bet:)
Deletehttps://www.tradingview.com/x/qWKtE17y/
ReplyDeletethe Fed is "on top of thing", Fed Chair Powell, aware that everyone was looking at the Fed for guidance on what happens next and whether it will conduct an emergency Sunday night global intervention in markets, at exactly 2:30pm on Friday with 90 minutes left until the close, Powell issued an unprecedented statement meant to do just one thing: calm markets and stop the selloff.
ReplyDeleteThe fundamentals of the U.S. economy remain strong. However, the coronavirus poses evolving risks to economic activity. The Federal Reserve is closely monitoring developments and their implications for the economic outlook. We will use our tools and act as appropriate to support the economy.
While Powell admitted what everyone knows, namely that the coronavirus “poses evolving risks” to U.S. growth and signaled the central bank is prepared to cut interest rates if necessary to support the expansion, what nobody still knows yet, is whether the current state of events is enough for the Fed to rush with a 25-50bps emergency rate cut as soon as Sunday.
Powell's statement, which was posted on the Fed's website 90 minutes before markets closed for the weekend comes as stocks were in their seventh-straight loss, prompting calls multiple rate cuts by Wall Street banks, and as markets expect more than 1 rate cut in March...
... as traders are now indicating that this is a preview of what now appears an almost certain Sunday night central bank intervention, whether standalone or coordinated with other global central banks.
DeleteAnd yet, as we warned earlier, a Sunday emergency rate cut could be the worst possible outcome. As we noted earlier in our "Sunday night action" preview post, the danger is that after a coordinated central bank response, investors will be forced into chasing a move higher in equities out of fear that they “missed the lows,” but into that inevitable “cluster” report of confirmed cases in a global mega-city outside of China (see what’s happening in California now as prime target), "as the pandemic is now certainly “real”—which could drive another shock-down, but this time, without the hedges which, on the way down, can also act as “insulation” when monetized."
In other words, if or rather when the corona pandemic gets even worse after central banks have fired their collective bazooka, the market's response will be far more adverse as central banks will have staked their credibility on being able to offset the economic consequences of the pandemic (they can't, unless they can print viral antibodies), while investors will now be looking into the abyss without any hedges left.
And that could be catastrophic.
wave 4? your thoughts? Close is looking ugly https://www.tradingview.com/x/nepWrYOM/
ReplyDeleteYes, it does not look like we have a bottom.
Delete