Trading trigger - buy signal.
Analysis - long term sell the rips, we have major top. Intermediate term probbably triangle difficult to trade.
P.S. - for a trade both analysis and trigger should point in the same direction.
TECHNICAL PICTURE and ELLIOTT WAVES
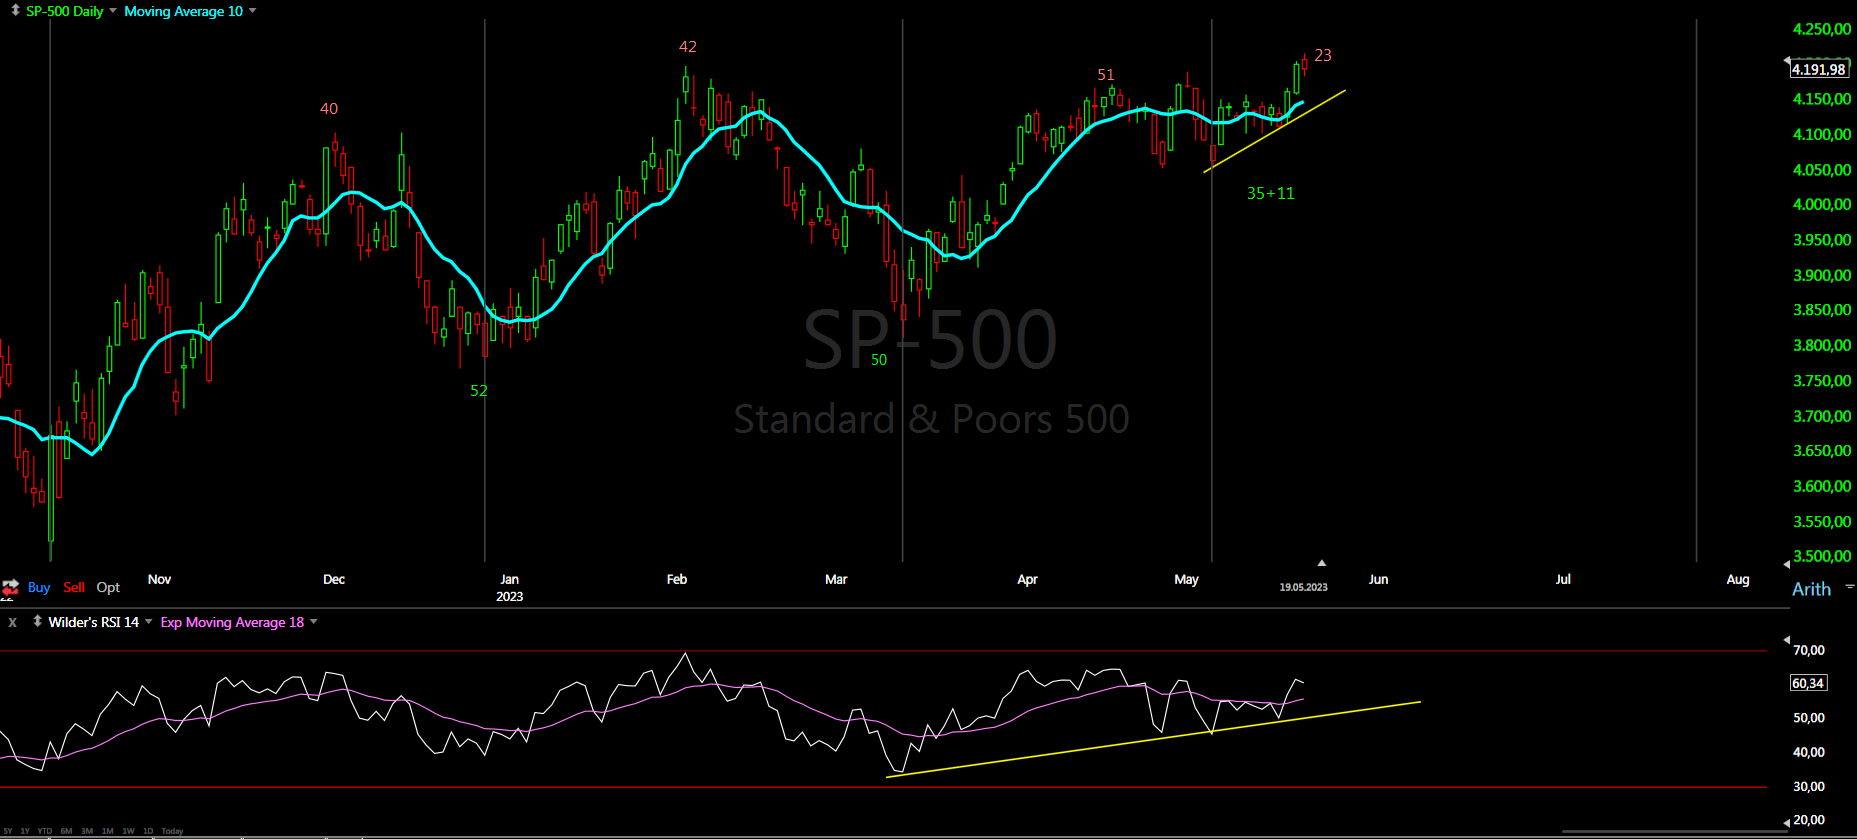
Short term - two zig-zags with roughly the same size for double zig-zag higher and now move in the opposite direction skewed by tech stocks. For the real pattern look NYSE for example.Notice the double divergences...

Intermediate term - four patterns two variations of a double zig-zag and two triangles, both waves A and B will have roughly the same size and the outcome is not very different: - complex w-x-y with x-wave(white) triangle. and B will retrace close to 62%. - y/B(yellow) is the triangle and roughly 50% retracement. - double zig-zag the top of w is in early February then x(red) and now in b/y/B and 62% retracement. - double zig-zag the top of w is in early December then x(green) and now in c/y/B and 62% retracement.

Long term - most likely huge double zig-zag from the 2009 low B-wave was completed and multi year decline has started. If we are lucky it is lower degree b-wave.

MARKET BREADTH INDICATORS
Market Breadth Indicators - turned higher nothing to suggest strength so far.
McClellan Oscillator - around zero.
McClellan Summation Index - buy signal.
Weekly Stochastic of the Summation Index - sell signal.
Bullish Percentage - turned higher, in the middle of the range.
Percent of Stocks above MA50 - turned higher, in the middle of the range.
Fear Indicator VIX - turned lower.
Advance-Decline Issues - up and down, in the middle of the range.
HURST CYCLES
Short term cycles - maybe extended 10w cycles consisting of 3x5w cycles as the previous two. Now at 5w high next should be move lower for the next 10w low? or 20w cycle low?

As suggested the 18m low should be in October 2022. The 40w lows/highs are at pattern inflection points as it should be and in sync with the European indices which is important.
Months ago I have suggested the 40w cycle looks like 3x10w cycles. If we have triangle the current 40w cycles low and high count better as three longer 10w cycles. If it is a double zig-zag this should be 20w high(now at week 15) from early February and next is turn lower into 20w low.

Excellent post as always.
ReplyDeleteI will never understand why people fight price action. Everyone and their mom has been waiting for a lower low. Everyone on fintwit calling a bear market rally. Breaking the 2022 trendline, golden cross, above 200 day, etc all say otherwise. I'll turn bearish when all the fintwit tards turn bullish or price action tells me. People complicate stuff.
ReplyDeleteYou are right, the market always does the opposite of what retail would like, the great collapse due to the covid that never happened was proof of this.
DeleteThey stopped the covid crash and bear market by printing unprecedented amounts of money. The resulting inflation and debt are now putting them in between a rock and a hard place. But no one knew they had that kind of power back during the covid crash. Now everyone watches the FED’s every move.
DeleteAt the top of the B-wave stupidity is rising again... all kind of excuses.
ReplyDeleteAfter the excess bullshit in 2019 I will not waste my time to argue with clueless guys.
thank you krasi. based on last week's action i think we have a small dip next couple of days to complete a 5 week low, followed by an end of month rally which will coincide with the ridiculous debt ceiling issue.. beginning june is where the fun begins. next 10/20 week low end of june and 40 week low in october. we just need the delusional bulls to get arrogant one more time first. i think this scenario fits with your previous forecast a couple of weeks ago. we'll see.
ReplyDeleteJP
5 week low should be in today, latest tomorrow, let's see..
DeleteJP
what is clear is that in the summer we should see an bullish rebound from the 40 week low
ReplyDeleteAt support, bulls need to step in
ReplyDeleteThis looks familiar https://img.phemex.com/wp-content/uploads/2020/12/29093206/Wyckoff-Distribution-.jpg
ReplyDelete