Trading trigger - buy signal, crosses in both directions.
Analysis - long term sell the rips, we have major top. Intermediate term high - impotant high in a few weeks expected.
P.S. - for a trade both analysis and trigger should point in the same direction.
TECHNICAL PICTURE and ELLIOTT WAVES
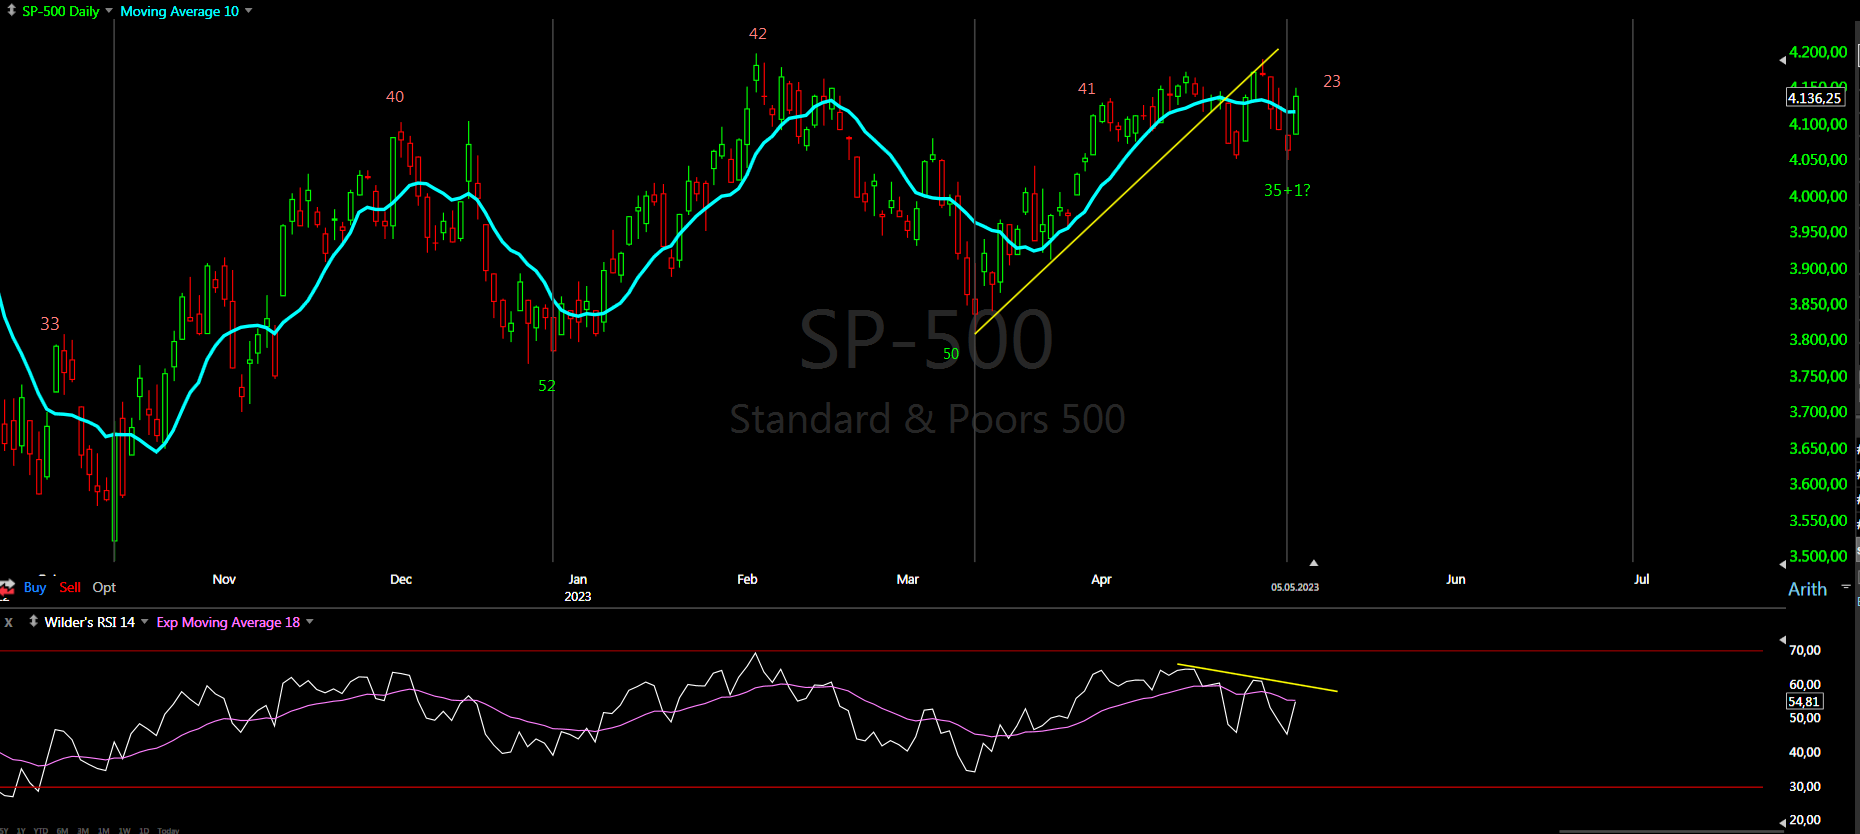
Short term - sideways price action, it looks like complex b-wave - this is what I see currently... such corrections are impossible to forecast, the important information is correction not reversal.I have never seen expanding triangle playing out so sudden sell off will not surprise me.

Intermediate term - the indices are a few weeks away from the top of the correction. It is a complex pattern and I am not sure where the B-wave starts - in June or October. It could be w-x-y from October or triangle starting in June.

Long term - most likely huge double zig-zag from the 2009 low B-wave was completed and multi year decline has started. If we are lucky it is lower degree b-wave.

MARKET BREADTH INDICATORS
Market Breadth Indicators - moving lower...
McClellan Oscillator - turned higher.
McClellan Summation Index - sell signal.
Weekly Stochastic of the Summation Index - sell signal.
Bullish Percentage - pointing lower, in the middle of the range.
Percent of Stocks above MA50 - up and down, in the middle of the range.
Fear Indicator VIX - up and down.
Advance-Decline Issues - moving lower.
HURST CYCLES
Short term cycles - close to 20d low which should be 10w low - do we have short cycle only 6 days? One more 5w cycle and we will have 20w cycle high from the last important high early February.

Week 8 for the 20w cycle. Close to important high and next should be the last 40w cycle of the 4y cycle.

Hi Krasi, I am aware that you don't follow such indicators but thought I will ask anyways. Investor sentiment is at record low. It's probably lower than 2008 crisis. Such indicators are usually seen at extreme levels at bottoms. It also means many investors/ traders are hedged, etc. What do you think of such information?
ReplyDeleteThis indicator is not reliable for timing/trading, but probably confirms cycles that the important low 4y cycle low is not far away - I expect strong but short living second leg... in September/October it should be over with the current 4y cycle.
DeleteThanks Krasi
DeleteIs it possible 4y low will not go below Sept / Oct '22 lows?
DeleteNo, we must see fear. Until now we have choppy decline and very long sideways move and a lot of complacency - VIX is lower compared to the ATH the end of 2021.
Deletethank you krasi. a test of the 4200 spx level after a little pullback would be the greatest gift for bears. it will complete a broadening top formation (megaphone), probably within 4-6 trading days. i hope it happens.
ReplyDeleteJP
as long as 4162 ES is not broken wave B is completed and we head south. we'll see
DeleteJP
Just gonna float around and kill the majority of traders. Over 4200 might get interesting for shorts
ReplyDelete4162 ES is the stop. if broken will re-short above 4200. in any case wouldn't touch the long side before memorial day.
DeleteJP
New bull market Krasi?
ReplyDeleteYes, I see 5000 in summer
Deletebull market !?!?! six weeks crap is not really a change to a bull market.
Deletei love how they stop out every short before reversing it, criminals!! 4000ES next and this week.
ReplyDeleteJP
4200 plus by Friday then we short
ReplyDeleteit looks like you will be right. i covered and i am praying they do... biggest gift!
DeleteJP
there's a gap on spy at 4220, once we get there the big boys may be done with this crap.
Deletethanks, but not sure it will get there. i have a short term high tomorrow and and short term low on monday may 15 (not a high). they are making it difficult until they pull the rug.. will start gradually building short position again.
DeleteJP
Something like this
Deletehttps://img.phemex.com/wp-content/uploads/2020/12/29093206/Wyckoff-Distribution-.jpg
Six weeks crap, if you look at the indicators like RSI we have zig-zag(w) sideways correction(x) and now the third wave is running which is a mess... either x is not over or y is a triangle - https://invst.ly/100hj5
ReplyDeletefor futures expiration of June 40w low?
ReplyDeleteIf you count from the October low...
Deletekrasi, could it be that mid june is a 20 week low and the big 40week low is in october? thank you
DeleteJP
Yes, this is my primary scenario
Deletegreat!! thank you
Deletewhipsaw galore!! are we having fun yet:)) this thing is going to end real bad..
ReplyDeleteJP
next short term low is next monday/tuesday, we should test the 4000-4050 ES by then. let's see.
DeleteThe market has a fever, and the only prescription is 4200
ReplyDelete