Trading trigger - sell signal.
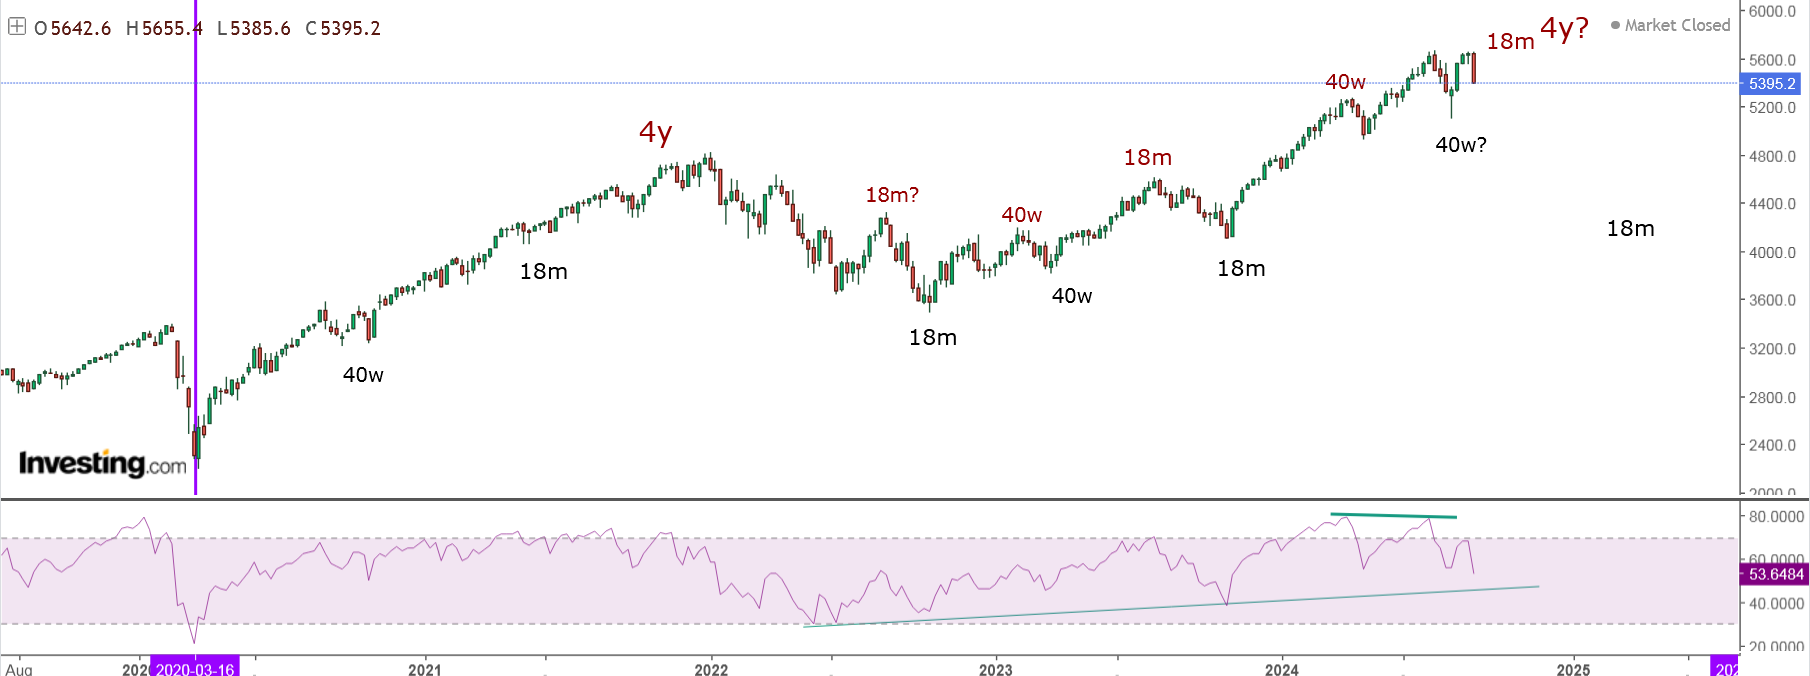
Analysis - long term important high 18m/4y high. Intermediate term 40w low and now higher into 40w high.
P.S. - for a trade both analysis and trigger should point in the same direction.

TECHNICAL PICTURE and ELLIOTT WAVES
Short term - a-b-c or impulse with truncated fifth wave. Now w/X-wave or a-wave close to completition.

Intermediate term - it looks like complex pattern for the Y-wave... maybe we will see one more move up to complete the cycle. Alternate we saw the top.

Long term - double zig-zag(from 2020) for y/B at 9y cycle high 2000-2007-2015-2024.

MARKET BREADTH INDICATORS
Market Breadth Indicators - turning lower and long term divergences.
McClellan Oscillator - below zero.
McClellan Summation Index - sell signal.
Weekly Stochastic of the Summation Index - buy signal.
Bullish Percentage - turned lower and long term divergences.
Percent of Stocks above MA50 - turned lower and long term divergences.
Advance-Decline Issues - moving lower, in the middle of the range.
Fear Indicator VIX - turned higher.
HURST CYCLES
Short term cycles - most likely we have 10w high and now lower into 10w low. Next week we should see 20d low.

Higher into 40w high and possible shorter 4y cycle high....
Hi Krasi
ReplyDeleteIs a correction where S and P hits 3600 possible?
Thanks
Yes
Deletekrasi how are we looking the market today. looks very bullish towards breaking 5500 and higher?
ReplyDeleteSo tomorrow we start selling into late September? Seems your charts are pointing to that. That's what the wave count looks like to me.
ReplyDeleteSo we are going to one more high for y/y? It looks too strong for b
ReplyDeleteso quiet now? all dead or lost all money? 5700 coming. amazing SPX movement. is this within Krasi movement?
ReplyDelete5800
ReplyDelete6000
Delete