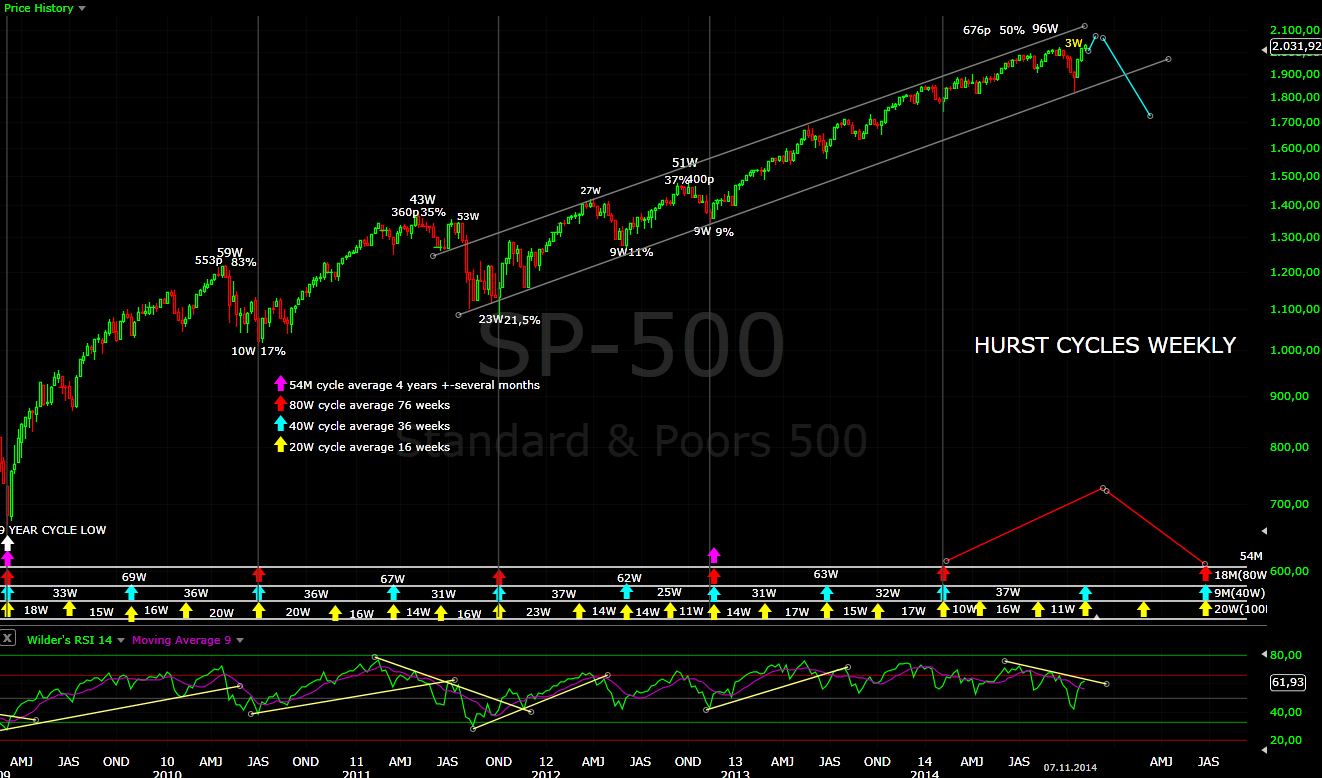
Intermediate term view - pullback after a short term top and another move higher.
Nothing new, even more boring week than the previous one. Higher high on Monday as expected and than indecision candles four days in a row.... it would not have made a difference if the market were close for four days:)
As I wrote two weeks ago expect 2-3 weeks before a short term top and the market grinding higher playing within the 2030-2040 range. Next week is the third one I hope we will see some move up or down at last.
Market breadth shows weakness and the 40 day cycle looks ripe so the odds look good for a top next week.
The plan has not changed - I expect to see a short term top next week. I think the move lower will be only a pullback for several weeks followed by another move higher. But I will watch carefully the price action witch should not be impulsive and should not show strength.
TECHNICAL PICTURE
Short term - it looks like the SP500 wants to make one final high... but watch out for a reversal candle, maybe a intraday reversal.
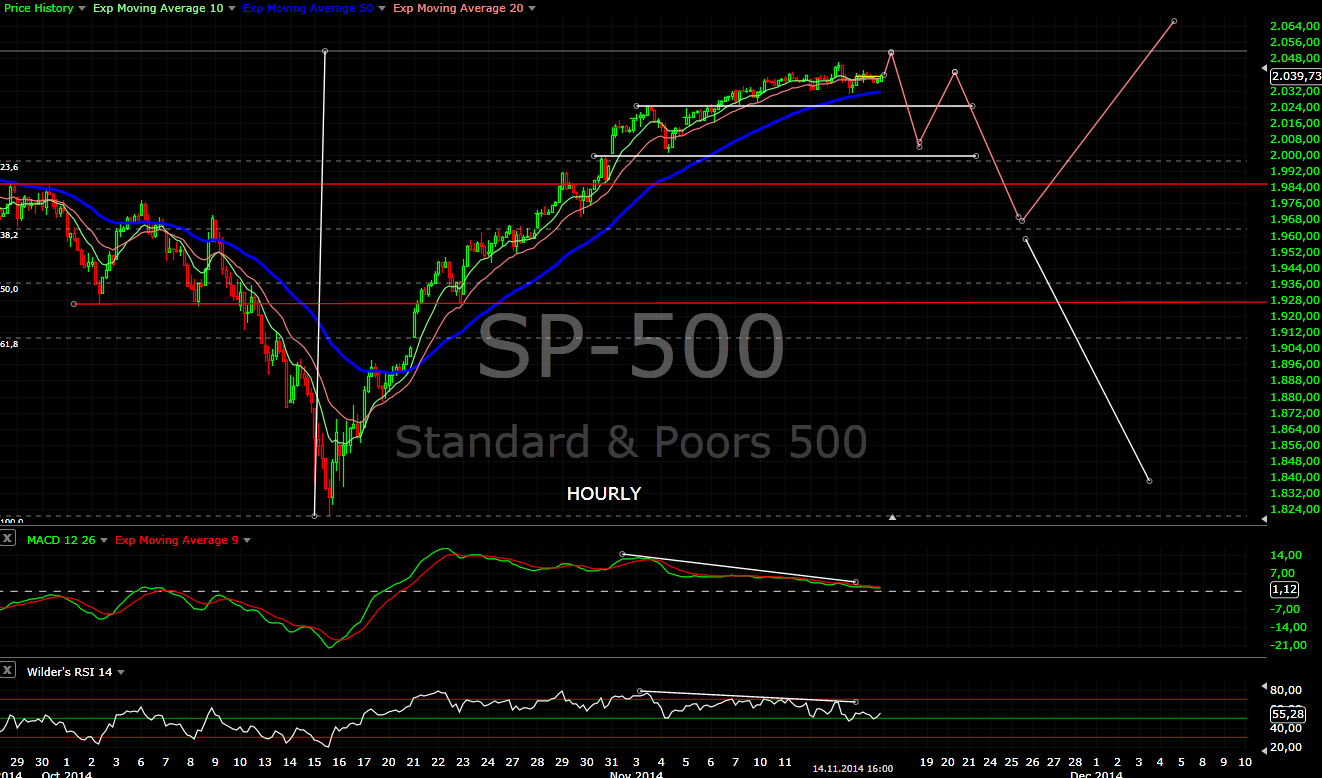
Intermediate term - no change.... waiting for a short term top and how the move lower will look like.

Long term - the long term picture is unchanged.

MARKET BREADTH INDICATORS
The Market Breadth Indicators - oscillators are moving lower the whole week and they look tired, the trend following indicators have not changed - swing higher is running.
McClellan Oscillator - moving lower there is no strength any more... short term top around the corner?
McClellan Summation Index - buy signal.
Weekly Stochastic of the Summation Index - buy signal, but reached overbought territory.
Bullish Percentage - still below 70... not so much strength after such an explosive move.
Percent of Stocks above MA50 - in overbought territory, short term the move is still healthy.
Fear Indicator VIX - plunged but I think we will see another higher low.
Advance-Decline Issues - shows weakness moving lower for two weeks.
Percent of Stocks above MA200 - a lot of bullishness and ATH, but only half of the shares are above MA200. I think we are one step nearer to an important top
HURST CYCLES
Day 21 of the current 40 day cycle. I think next week we should see a short term top.

Week 4 of the current 20 week and 40 week cycle. If the alternate scenario plays out I will switch back to the previous cycle count that we are in the last 20 week cycle of the 18 month cycle.

Tom Demark SEQUENTIAL AND COUNTDOWN - this technique spots areas of exhaustion.
Day 8 of a countdown... nothing interesting on the daily or weekly chart.