Sep 8, 2018

Weekly preview

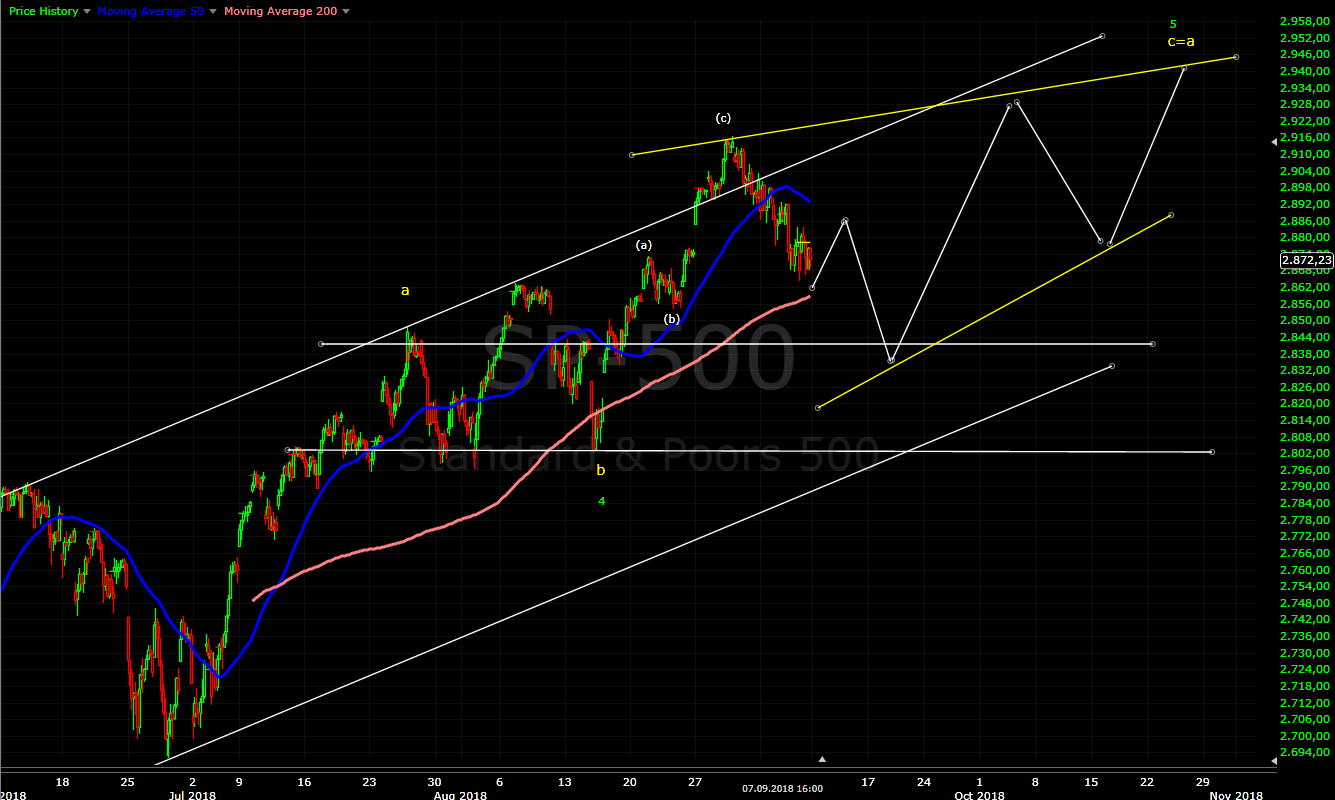
I was expecting to see correction in September and it is running. Target should be at least MA50 on the daily chart. The last leg higher looks to me like three waves. If we see only a zig-zag lower to MA50 it should be ED. The problem is we have very ugly weekly candle and cycles with marker breadth are pointing to decline for several weeks for 20 week cycle low.... I am curios could we see a decline for a few weeks to MA200 and the trend line from the Feb.2016 low for a rare pattern?(see the last chart). Anyway the leader the tech sector with clear impulse lower so expect more to the downside.

Some changes for the long term charts:
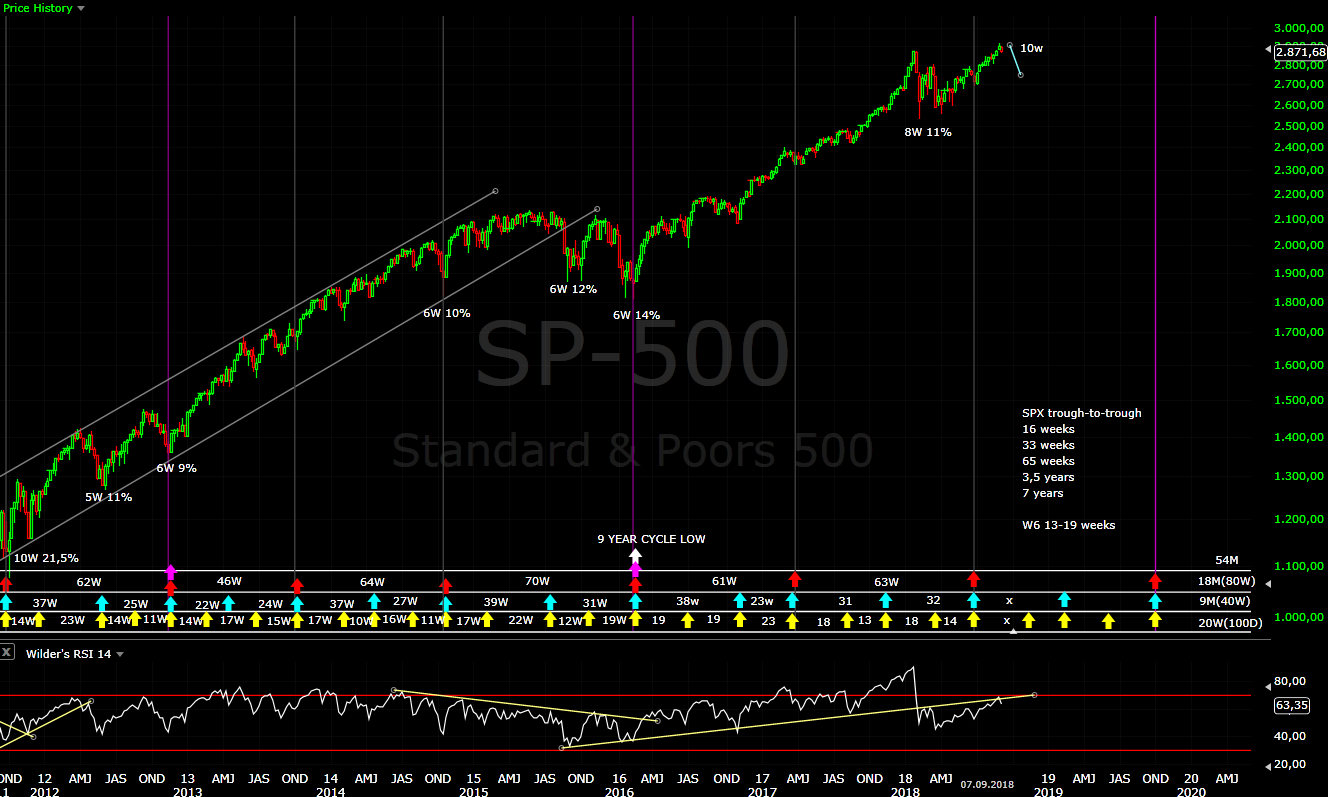
Cycles - the move up takes too long so it is more likely that the cyclical model with shorter 18 month cycles is the right one. Indexes like DJT,DJI,XLF,NYSE made a significant low right on time in June so I switched back to this cycle count.
Long term chart and EW - the current 4 year cycle is strong right translated and with high probability the next one will make higher high. This means it is more likely that the expected top is wave III from 2009 and not V. In 2019 we should see 4 year cycle low and most likely we will see scary but short living correction 20%-30% which fits with wave IV from 2009.


TECHNICAL PICTURE and ELLIOTT WAVES
Short term - the bulls see i-ii iii of 3 of 3 to infinity what else:) nonsense of course. I see only three waves higher and decline which is not finished with target MA50 daily at least.

Intermediate term - we have two zig-zags higher B(red) or with some creativity you can count an impulse(green). Looking at the indicators and market breadth 3 of 3 of 3 is clear fantasy. RSI is saying a wave of bigger degree is running.
I will love to see a drop to MA200 and the trend line connecting the lows from Feb.2016(yellow) for a crazy pattern - expanded ending diagonal.


Long term - I was not very bearish for the long term, but now with the price moving higher more than 2/3 of the time it is more likely that this is wave III. Strong divergences MACD/RSI so the indexes are close to important top. Strong decline to purge greed are common in a bull market. Since 2009 we had twice 20% corrections after 2-3 years rally higher.
In the case of B wave(red) the decline will be too short both price and time testing MA200 and 0,236 retracement and wave II was already some expanded flat(EW alternation rule). The green scenario will look perfect - alternate pattern zig-zag, 38,2% retracement to support and the trend line, just on time for the 4 year cycle low. This is the preferred scenario for the long term.


MARKET BREADTH INDICATORS
Market Breadth Indicators - weak could not move into overbought territory and divergences. The difference is this time they are reacting to the move lower and I suspect they will drop lower with the indexes making one more higher high and market breadth with clear divergences signaling reversal.
McClellan Oscillator - heading for oversold levels.
McClellan Summation Index - sell signal with divergences.
Weekly Stochastic of the Summation Index - in overbought territory expecting to turn lower.
Bullish Percentage - turned lower.
Percent of Stocks above MA50 - turned lower.
Fear Indicator VIX - divergence... expecting multiple divergences with the indexes making one more high.
Advance-Decline Issues - this time it is reacting to the decline. I expect to see lower low and broken trend line followed by lower high and divergence with the indexes making final high.


HURST CYCLES
Day 17 for the daily cycle. Another three weeks or more before an important low.


Week 10... With the old model in September/October 18 month cycle low was expected, but instead weakness we are seeing strength. This fits with my initial model with shorter 18 month cycles so I switched back to it.

DJ the "crazy" pattern is better visible. I have never seen expanding ending diagonal, but who knows.... it will solve a lot of problems with synchronization between different indexes and some shares which I watch for guidance. If we see a zig-zag lower to MA200 with very high probability this is the pattern.

Sep 1, 2018

Weekly preview

The indexes touched the trend lines as expected, SPX slightly above it. Nothing changed so no need to change my analysis - decline is expected in September and it will show us what is going on.
I am showing a bullish case for those who see triangle and impulse higher. It does not fit with other indexes for example NYSE, but we will assume that we will see a non-confirmation SPX with higher high and NYSE lower high. To fit cycles I have to switch to my model with shorter cycles(last chart) not the best fit, but not impossible. I am starting to think that we have already 18 month cycle low in the summer because it is taking too long. Even in this case I see a move lower for wave iv of 5 something like 80-100 points.


TECHNICAL PICTURE and ELLIOTT WAVES
Short term - SP500 stronger than DJ moved slightly above the channel, but no decisive break out. EW, Fibo measurements and RSI are saying one more high to finish the impulse will look perfect - the labels in brackets.
Green labels for wave 3 the bullish case. Target for wave 4 is usually the low of the previous wave iv where we have support and the trend line.


Intermediate term - I think test of MA50 and the trend line is coming. If it is an impulse expect something more bearish and more to the downside - the analysis so far. If it is a corrective move it could be wave 4(green)


Long term - waiting to see what happens in the next few months.


MARKET BREADTH INDICATORS
Market Breadth Indicators - the same for months. I have the feeling market breadth does not react to rallies... I suppose only a few shares are pulling the market.
McClellan Oscillator - around zero.
McClellan Summation Index - buy signal with divergence so far.
Weekly Stochastic of the Summation Index - pointing up.
Bullish Percentage - another high and turned lower again.
Percent of Stocks above MA50 - barely touched the overbought level and turned lower.
Fear Indicator VIX - divergences.
Advance-Decline Issues - turned lower, still with higher lows and holding the trend line.


HURST CYCLES
Day 12 for the current daily cycle.


Week 9 for the 20 week cycle.


This is the "bullish case" with shorter 20 week cycles.... it is bullish only for the short term.