I was expecting wave iv and v of 5/c/B and it looks like this is playing out. Topping has begun - if the top is in we should see small waves iii-iv-v lower next week, but my feeling tells me another week before the pattern is finished.
TECHNICAL PICTURE and ELLIOTT WAVES
Short term - to confirm a top we need to see the decline continue next week breaking the trend line and support. The problem is we do not have a bearish candle on the daily chart and usually reversal does not start this way.... may be we are still in w4 or w5 is an ED, we will know next week.
Intermediate term - the indices are close at least to intermediate term high and if I am right we will see much deeper decline than most expect.
Long term - close to the top of wave B, after that expect sell off to begin and to continue into Q2.2020. It will complete the correction which begun in January 2018.
MARKET BREADTH INDICATORS
Market Breadth Indicators - Fear&Greed hit 97 on very weak market breadth on Thursday - a lot of complacency. Now starting to see the short term divergences, intermediate term high is around the corner.
McClellan Oscillator - lower highs, very weak on Thursday only 4 points higher.
SP500 McClellan Summation Index - buy signal with double divergences.
Weekly Stochastic of the Summation Index - buy signal, reached the overbought level.
Bullish Percentage - flat, still buy signal.
Percent of Stocks above MA50 - turned lower despite the strength from Thursday.
Fear Indicator VIX - more higher lows, preparing to spike higher.
Advance-Decline Issues - pointing lower with multiple divergences.
HURST CYCLES
Daily(trading) cycle - the days of this cycle are numbered, RSI with a sell signal already, but price is still above MA10 so sell signal is not triggered. Next week we should see either a bounce from MA10 and completion of the pattern or break below MA10 and sell signal activated. For now is wait patiently.
Hurst cycles - I am still experimenting with cycles... cycles vary 20 week cycle could be 18w or 20w or 22w - my theory as the cycle develops you can see if the smaller cycles are shorter or longer then adjust them for the current 20 week cycle. This is sine wave 20day cycle highs(or 14 trading days). I think this 20w cycle, which begun in September, should be shorter and the 14d cycles are 12-13 days long. I want to see at least 7 such cycles finished(next week) before the 20 week cycle makes a high and turns lower.
Week 13 reached 2/3 of the cycle, we should see a turn lower soon. The coming high is minimum 40week cycle high and after that we will see a decline until we hit 40 week cycle low and this is 6 months later mid 2020.
Jan 4, 2020
Jan 1, 2020
Long term - update
Happy New Year!!!!
I wish you successful year and good luck trading in 2020.
The current view for the next 6 months:
- Stocks - final wave lower to finish correction lasting more than two years and 4 year cycle low.
- Bonds - to finish a correction and one more high for 4 year cycle high.
- USD - one more leg higher to finish the move which began early 2018.
- Precious metals/miners - final sell off for the 4 year cycle low.
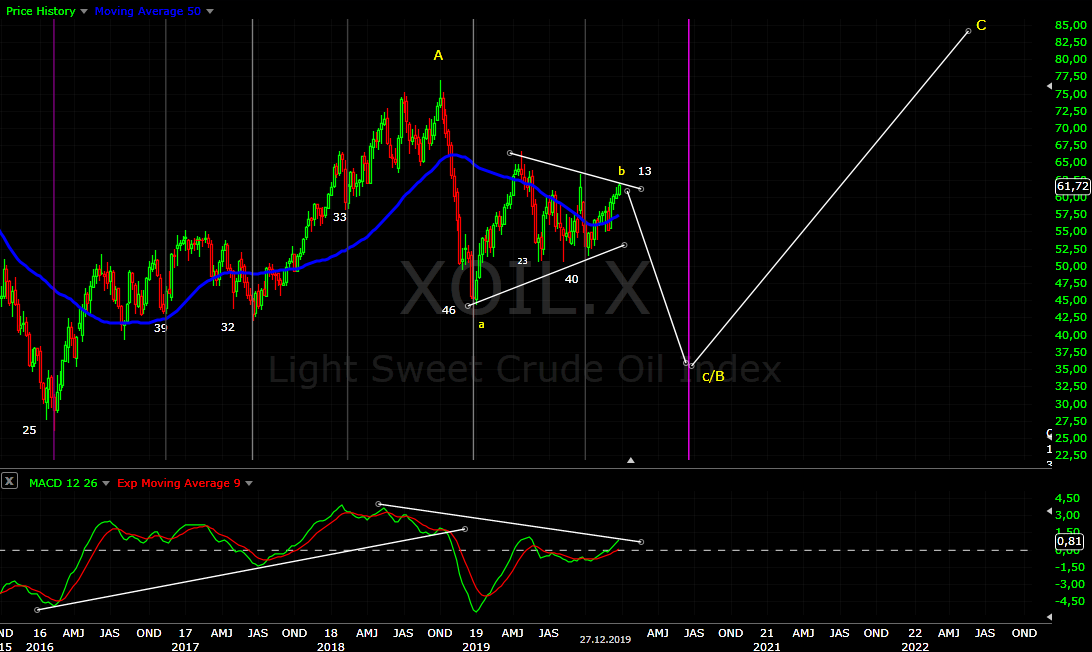
- Crude Oil - final leg lower to finish B wave and 4 year cycle low.
2020 should be an important year - all asset classes are aligned for final rally/sell off and 4 year cycle lows/highs.
- STOCKS
The bigger pattern which I am watching from 2018 is a flat correction for wave IV from 2009. We saw a-b-c/B in 2019 with C to follow in the first half of 2020. Completing expanded flat mid 2020(4y cycle low) will satisfy perfectly the 38% proportions between wave 3 and 4 both time and price. SP500 is stronger than other indexes and now everybody is convinced this is third wave... well it is not. Quick look at other indexes and it is pretty clear what is going on.
For this who want to see impulse you need 1-2 i-ii count - not very likely the first leg is corrective and the supposed w2 is shallow sideway move which is usually b wave. Or you can count w1 of a huge ED for V.
- BONDS
We saw a few months higher and correction in the last 4 months as expected.... but 4 year cycle high at month 37 is too short. More likely we will see the correction finished in 2-3 months and one more high to finish the 4 year cycle. Probably risk off trade the money moving from stocks to bonds - safety when the indices decline in third wave in Q2 2020.
10 year yield - final plunge and correcting higher is running as expected. Next we should see 2-3 months higher for the correction to be finished and turn lower again.
- FOREX
Six months later I can only repeat the same - the pattern is very challenging:) Many see the USD plunging lower and PM to the moon, but I sill think there is one final rally for the USD in 2020.
The USD bears see a-b-c with c diagonal and sharp plunge, I think this is A-B running and we should see C next year. The count is difficult it could be something different, but the idea is one more rally in the next 6 months.
JPY - very messy pattern with zig-zags higher and 4 year low expected next year so I will stay with the call that we have more to the downside.
USD/JPY - mirror image...
- GOLD/SILVER/MINERS
We saw the PM sector higher in July/August and turn lower as expected. The move higher was stronger than expected and the decline is corrective... how looks the long term picture now? The consensus is we have a break out and third wave for gold - I do not think so, the PM sector is in secular bear market. Do not get me wrong, gold will most likely test 1900, but this will be c/B and not wave 3.
For now lets focus on the next 6 months and I think the direction is lower for 4 year cycle low next year.
Gold - it is obvious why everybody see impulse 1-2-3=1,618x1,4 and now 5 running(green). I think we have a-b-c higher and now a-b-c lower is running. If I am wrong we will see higher high and again multi month correction. This will have implications for the bigger pattern, but I still think this is not the beginning of a third wave.
Silver - a look at the bigger picture suggests we should see final sell off to complete third 18 month cycle for 4 year cycle low in Q2.2020.
Gold miners - the same idea like stocks and PM - decline for 4 year cycle low. Cycles look pretty good - two 18 month cycles, 40w cycle low in October and now 20w cycle running. Move below the October low will mean the last 40w cycle turned lower and GDXJ will decline into 4 year cycle low.
- CRUDE OIL/NATGAS
I was not sure what is going on, in the middle of something corrective and six months later crude oil did not disappoint:) - very ugly corrective pattern. We should see one more leg lower to finish B wave and important cycle low.
The pattern is not easy... I am wondering if it is a triangle for b/B(better visible on brent oil)... anyway one more sell off is needed for finished pattern plus cycles point to important low next year.
Natgas - similar to crude oil it seems that Benner cycle sequence 11-10-7 works better than Hurst cycles. History is too short, but it seems to work good - HIGHS - 90(7)97(11)2008(10)2018(7)2025 / LOWS - 92(10)2002(7)2009(11)2020(10)2030.
Next important low is in 2020 which fits with the EW pattern.
I was expecting to see b/B wave higher... we have a zig-zag higher. Now we should see c/B lower.
Subscribe to:
Posts (Atom)