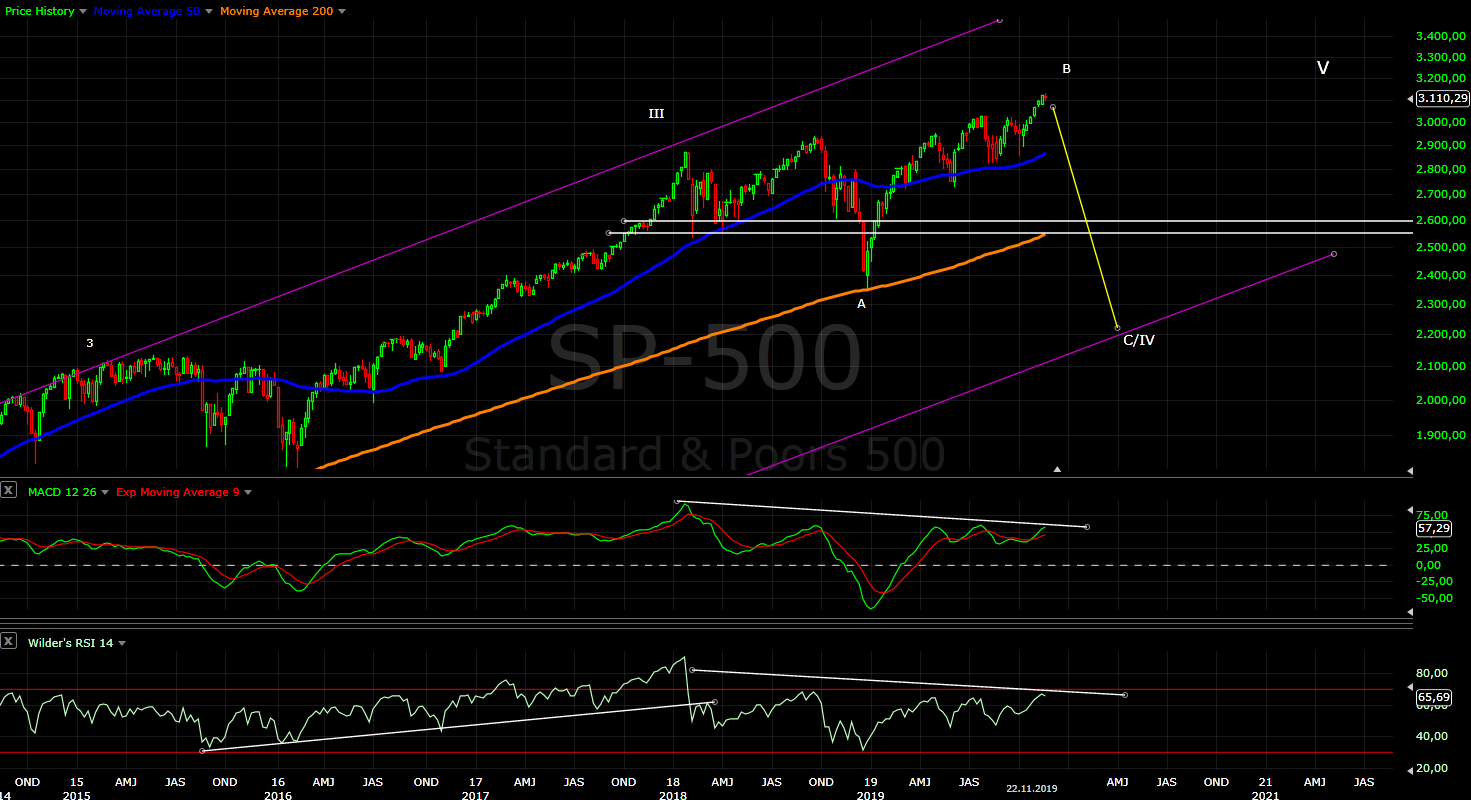
We have the final wave for the leg higher from the October low, now we should see the indexes decline at least to MA50 on the daily chart. We still need confirmation on Monday for reversal, but looking crude oil and the pattern for RUT it is more likely that the rally from October is finished.
My opinion is clear this is the high of wave B of a big correction which begun in Jan.2018 and it will be completed with one more leg lower around mid-2020.
TECHNICAL PICTURE and ELLIOTT WAVES
Short term - no matter how you count - impulse,impulse with extended fifth wave or a-b-c all this patterns are complete now and we should see decline starting next week. Confirmation is break of the trend line and move below 3090.
Intermediate term - one more touch of the trend line like July, MACD adding short term divergence to the multiple intermediate term divergences, RSI testing the broken trend line.
Next we should see decline to MA50 or MA200 to test one of the support levels. This wave lower with its size and shape will give us more information what is going on.
Long term - at the top of wave B. Expect sell off to begin and to continue into Q2.2020 to complete the correction which begun in January 2018. Alternate scenario a decline in three waves, but still a decline.
MARKET BREADTH INDICATORS
Market Breadth Indicators - the same weak with multiple divergences.
McClellan Oscillator - above zero with multiple divergences.
McClellan Summation Index - sell signal with multiple divergences.
Weekly Stochastic of the Summation Index - sell signal.
Bullish Percentage - at the overbought level with multiple divergences.
Percent of Stocks above MA50 - at the overbought level with multiple divergences.
Fear Indicator VIX - expect sharp rise higher after building base for a while.
Advance-Decline Issues - in the middle of the range with multiple divergences.
HURST CYCLES
Day 6 for the second daily cycle.
Week 14 for the 20 week cycle.
Nov 30, 2019
Nov 23, 2019
Weekly preview
Lower but we do not have an impulse yet to confirm reversal. I think reversal fits better, but until we see confirmation we have to assume that one more high is possible.... maybe something like the July high - one more touch of the trend line(see the daily chart).
The big picture is the same - I expect important high wave c/B to be completed and the final wave lower in to mid-2020 to finish the correction. Disclaimer: all this below are just fancy looking colorful pictures for fun:) Do not trade based on them. Do not blame me for your trades. TECHNICAL PICTURE and ELLIOTT WAVES
Short term - if you think this is an "impulse" w4 is now running with one more high for w5. The price action the last three days is very choppy and overlapping and I do not see how this is a turn up again, more likely another move lower. As long as the price stays in the channel it is possible that this is c/4, but if the channel is broken we have reversal.
My feeling tells me this is not the right pattern. This count does not fit well with DJ and NDX and the message from RSI(see DJ below). This second part of the rally looks bigger and stronger creating the illusion for a third wave, when in fact it just takes longer and has the same size.
For DJ counting an impulse does not work so good - this is classical a-b-c pattern with "a" as a zig-zag, "c" as an impulse and a=c... or some are counting fifth extended wave(yellow). For this counts one more high does not look so good because you need small wave iv of c or 5 an it takes already too long. RSI says the movfe from the October low is finished we have broken trend line which is tested now.
Intermediate term - RSI hit overbought level and broke the trend line so either we have a top or one more touch of the trend line with divergences like in July. There is no more third waves or extensions what ever. We have three consecutive higher highs and MACD with lower highs multiple divergence, I do not see how this is not a top.
I explained above that this is probably corrective leg so in this case you can count expanding ED for c/B... better visible on the futures. This pattern is extremely seldom, I call it unicorn:) I have never seen one maybe this is the first time.
Long term - we are nearing the top of wave B and sell off into Q2.2020 should complete the correction which begun in January 2018. Alternate scenario a decline in three waves, but still a decline.
MARKET BREADTH INDICATORS
Market Breadth Indicators - weak and turned lower again.
McClellan Oscillator - below zero.
McClellan Summation Index - sell signal with divergences.
Weekly Stochastic of the Summation Index - sell signal with divergences.
Bullish Percentage - turned lower with divergences.
Percent of Stocks above MA50 - turned lower with divergences.
Fear Indicator VIX - building a base, spike higher expected.
Advance-Decline Issues - heading lower no signs of strength.
HURST CYCLES
Day 63, RSI and price broke the trend line and RSI broke below MA18 signaling daily cycle turning lower.
Week 13 for the 20 week cycle.
The big picture is the same - I expect important high wave c/B to be completed and the final wave lower in to mid-2020 to finish the correction. Disclaimer: all this below are just fancy looking colorful pictures for fun:) Do not trade based on them. Do not blame me for your trades. TECHNICAL PICTURE and ELLIOTT WAVES
Short term - if you think this is an "impulse" w4 is now running with one more high for w5. The price action the last three days is very choppy and overlapping and I do not see how this is a turn up again, more likely another move lower. As long as the price stays in the channel it is possible that this is c/4, but if the channel is broken we have reversal.
My feeling tells me this is not the right pattern. This count does not fit well with DJ and NDX and the message from RSI(see DJ below). This second part of the rally looks bigger and stronger creating the illusion for a third wave, when in fact it just takes longer and has the same size.
For DJ counting an impulse does not work so good - this is classical a-b-c pattern with "a" as a zig-zag, "c" as an impulse and a=c... or some are counting fifth extended wave(yellow). For this counts one more high does not look so good because you need small wave iv of c or 5 an it takes already too long. RSI says the movfe from the October low is finished we have broken trend line which is tested now.
Intermediate term - RSI hit overbought level and broke the trend line so either we have a top or one more touch of the trend line with divergences like in July. There is no more third waves or extensions what ever. We have three consecutive higher highs and MACD with lower highs multiple divergence, I do not see how this is not a top.
I explained above that this is probably corrective leg so in this case you can count expanding ED for c/B... better visible on the futures. This pattern is extremely seldom, I call it unicorn:) I have never seen one maybe this is the first time.
Long term - we are nearing the top of wave B and sell off into Q2.2020 should complete the correction which begun in January 2018. Alternate scenario a decline in three waves, but still a decline.
MARKET BREADTH INDICATORS
Market Breadth Indicators - weak and turned lower again.
McClellan Oscillator - below zero.
McClellan Summation Index - sell signal with divergences.
Weekly Stochastic of the Summation Index - sell signal with divergences.
Bullish Percentage - turned lower with divergences.
Percent of Stocks above MA50 - turned lower with divergences.
Fear Indicator VIX - building a base, spike higher expected.
Advance-Decline Issues - heading lower no signs of strength.
HURST CYCLES
Day 63, RSI and price broke the trend line and RSI broke below MA18 signaling daily cycle turning lower.
Week 13 for the 20 week cycle.
Subscribe to:
Posts (Atom)