Current thoughts:
The long term picture - I think we entered a cyclical bear market.
- we have lower highs and lower lows and that means down trend
- we will see 50MA crossing 200MA which means bear market
- broken trend line from the 2009 bottom
- S&P500 Percent of Stocks above 200 day MA in a bear market territory
The intermediate term picture - I think we will see intermediate term bottom carved out. Expect:
- bounce - see short term picture
- some kind of retest of the low - it could be higher low, double bottom or lower low. I do not know but the low of inertia says we will visit it again.
- bear market rally lasting at least 6-8 weeks
The short term picture - Is this the bottom? I do not know, but look at this charts:
- S&P500 Percent of Stocks above 50 day MA the stocks are beaten down hard.
- NYSE McClellan Oscillator is at extremes. Such levels we see short before a bottom.
- VXO hitting extreme of 41 and retracing.
That does not mean they can not get more oversold, but the odds are higher that we will see soon a bounce from oversold levels and further push lower is a buying opportunity and not a selling opportunity. The prices are stretched too far from 50MA and 200MA. They will snap back because the MA are like magnets.
So current expectations are for a bounce because the indexes are oversold,retest of the lows and strong rally which will convince everybody that we are in a bull market and higher highs are ahead. Alternation is lower lows with divergence before the rally. Low probability going lower all the way down to the major support.
Bellow are charts of different time frames showing my plan and charts of DJ weekly and DAX daily showing how it played out in 2007. The similarities with DAX till now are amazing:)
DJ 2007 - three peaks, plunge, retest of the low and bear market rally. The same story till now.
Currently in a cyclical bear market - the first leg is nearing its end. consolidation and a rally - it will last 4-5 months(like in 2007) long enough to forget the pain and to convince everybody that we are in a bull market. Another leg down to major support.

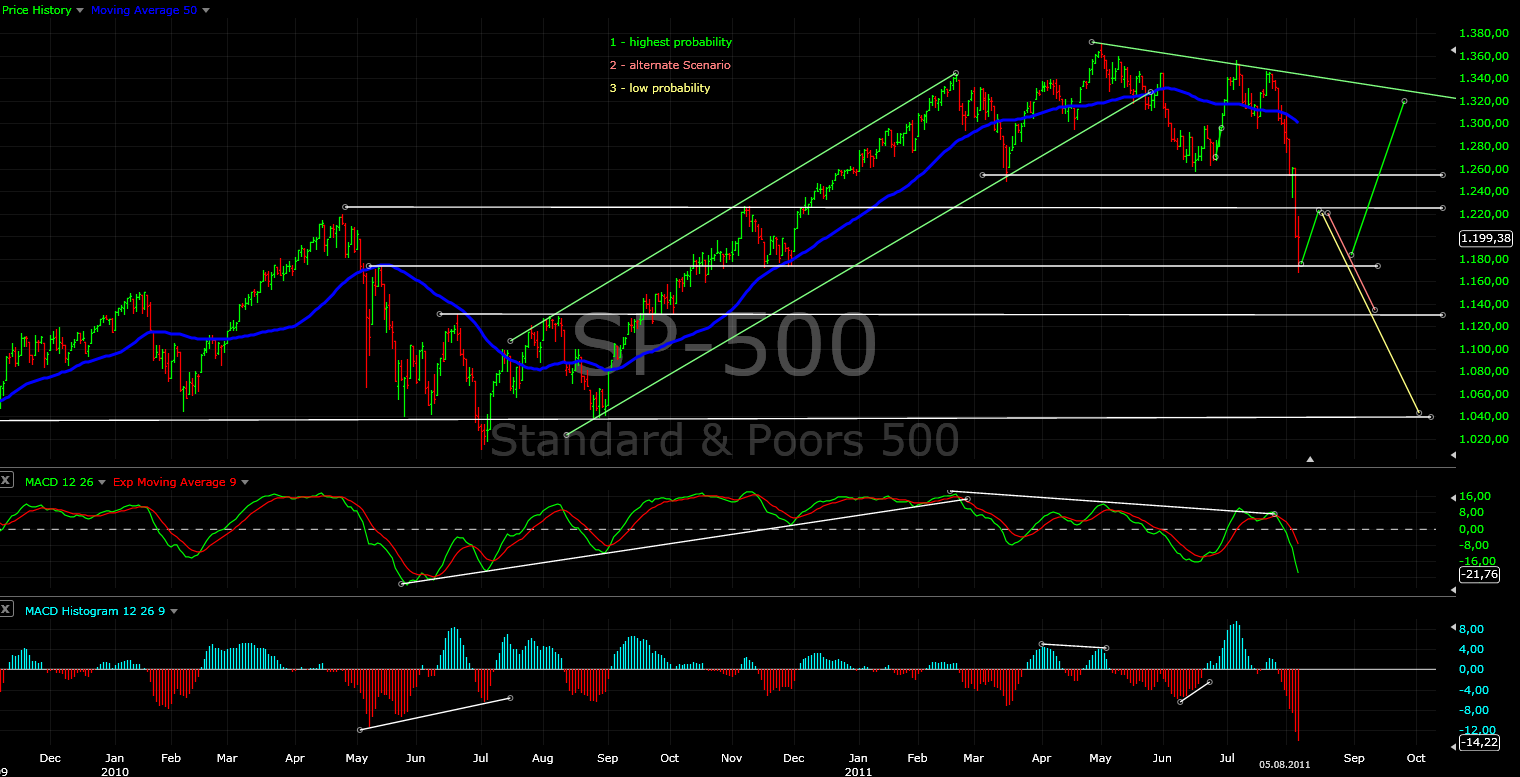
Daily chart with support levels which match perfectly the Fibonacci retracement levels. The expected bounce and retest of the lows. It is difficult to say how the retest of the lows will look like so the two options with highest probability are shown.

Hourly chart - expect a bounce in the form of three waves. It could hit the 38,2% or the 50% retracement no one can say.
But be patient we will see wild moves up and down before a tradable bottom. The indicators still does not show bottom and reversal.

The similarities are stunning so can not ignore this chart.

No comments:
Post a Comment