Intermediate term view - one more leg lower but short living.... 2 weeks probably and intermediate term bottom.
We had the expected short term bottom and the choppy move higher confirms that this should be only correction before one final sell off.
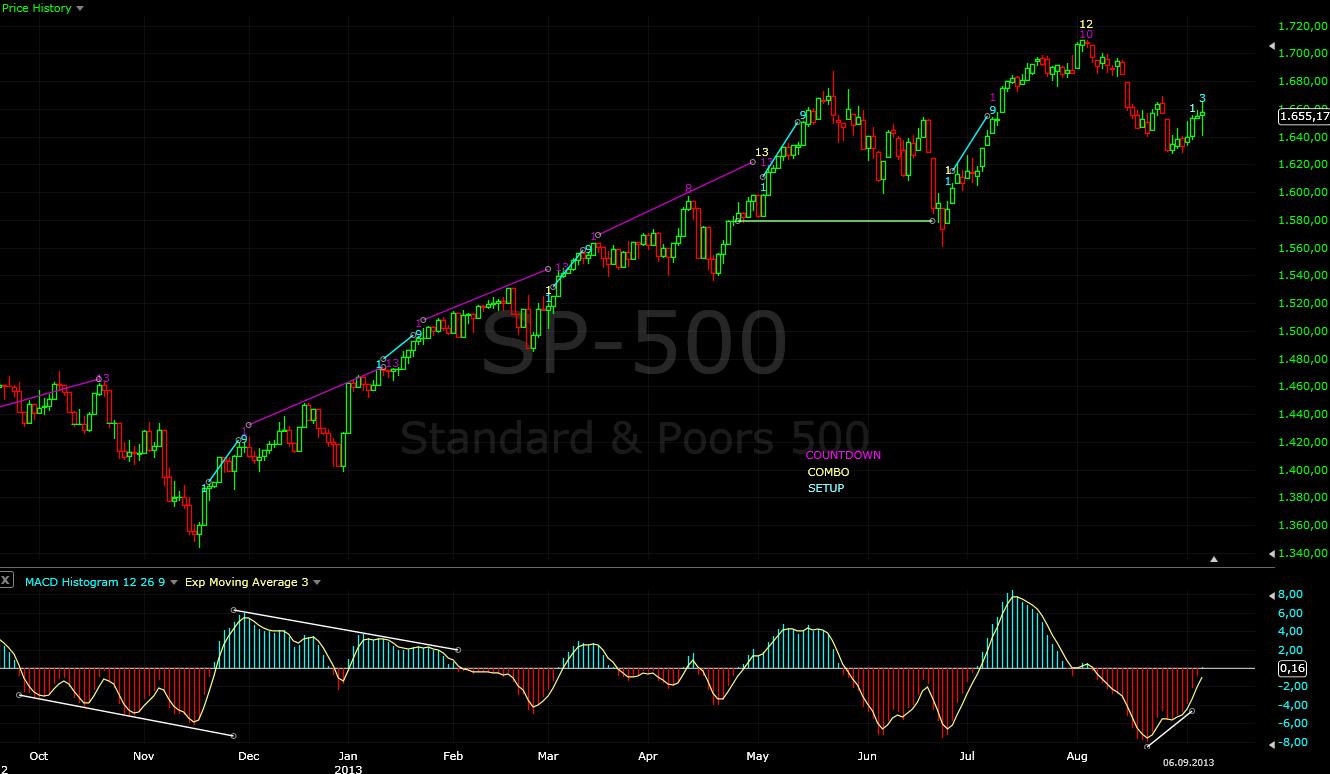
The move higher already looks awful - very choppy, tested MA50 on the daily chart, the upper trend line of the channel(the first chart) just a few points shy of 50% Fibo retracement and all that with divergences on the hourly chart. It can always try to push one more time higher to overshoot the channel and touch resistance at 50% Fibo around 1670, but the next move should be lower.
TECHNICAL PICTURE
Short term - we either saw the top on Friday or the move will top out few points higher on Monday-Tuesday. It does not matter the next bigger move is down.

Intermediate term - SP500 is testing MA50 with bearish flag and one more sell off should follow. It will be short living with target between 1600-1575 - 38% Fibo,MA200,the June low.

- Momentum Histogram/RSI - momentum is still up, short term trend is still up.
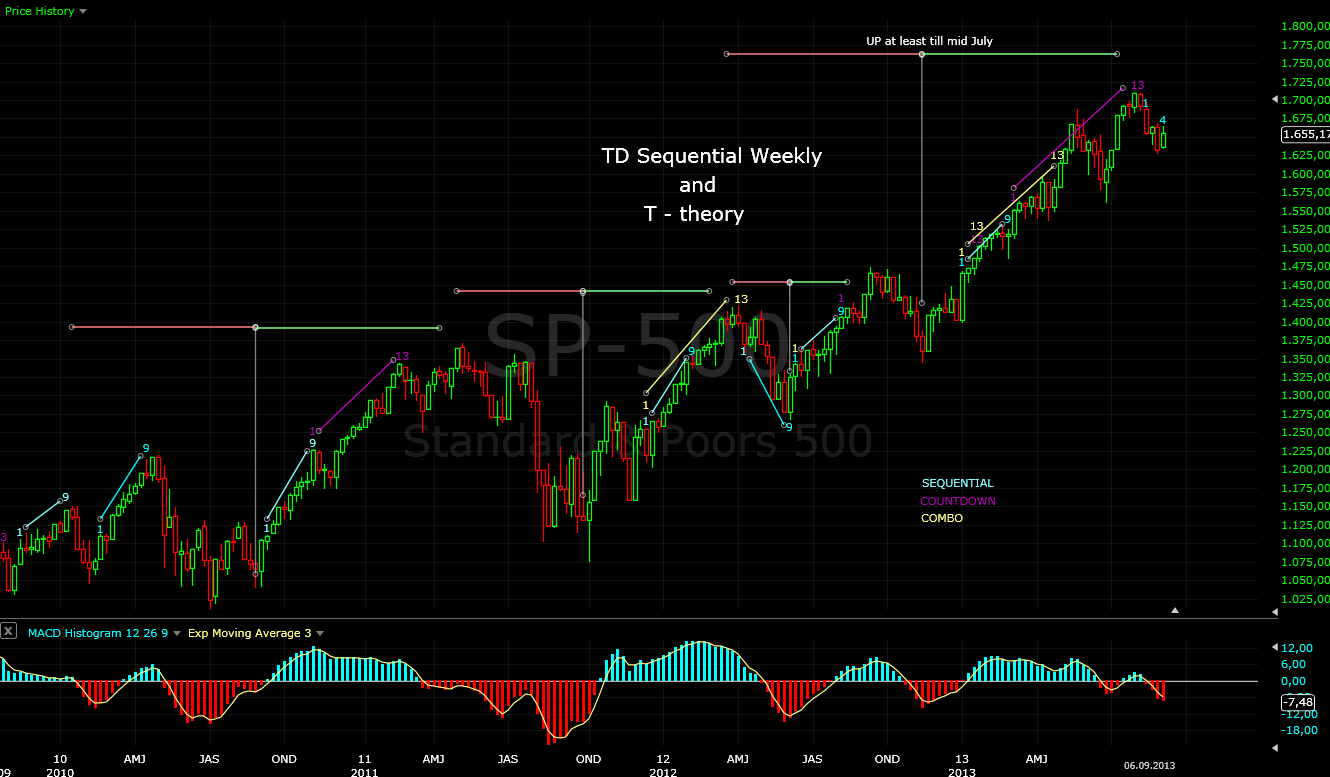
Long term - no change, the indexes are following the plan. MACD is nearing it's trend line and the price MA50... I think intermediate term bottom is few weeks away finishing leg three of the pattern.

- Momentum Histogram/RSI - momentum is pointing down, intermediate term trend is down.
MARKET BREADTH INDICATORS
The Market Breadth Indicators - the oscillators have reseted from oversold levels McClellan Oscillator for example is above the zero now. The trend indicators are still pointing lower.
McClellan Oscillator - moved back in positive territory after hitting extreme -100. We have the short term bottom as expected.
McClellan Summation Index - still showing sell signal, correction not over.
Weekly Stochastic of the Summation Index - sell signal, but reached oversold levels. We should see something on the upside, probably after 2-3 weeks and 20 week cycle bottom.
Bullish Percentage - sell signal pointing lower, but still at higher levels. This is just a correction...
Percent of Stocks above MA50 - some relief and moving to around 50. One more push lower and it will look perfect.
Fear Indicator VXO - Cool off as expected after several days outside the bollinger bands.
Issues Advancing - relief after extreme levels, another move lower with divergence like the previous bottom will look great.
Issues Declining - the same story like above but reverse:)
HURST CYCLES
The shortest cycles are not very clear, but it is clear that the longer cycle has topped out making a nice arc. The second important thing is - look at the previous cycle how it topped very late in the cycle and the current one how it topped early in the cycle. That means that the 18 month cycle shown on the second chart already topped out and it is pulling the prices lower.

At week 11 already, we should see intermediate term bottom in the next 2-3 weeks and rally for several weeks before very serious correction for 18 month cycle low.

Tom Demark SEQUENTIAL AND COUNTDOWN - this technique spots areas of exhaustion.
At 3 of a sell setup... I do not think it will be finished. Maybe four on Monday, but SP500 must close above 1653 on Tuesday or we will see another price flip and short term reversal lower.
Krasi,
ReplyDeleteDo you have a sense of the approximate date for the 18 month cycle low? It appears on the chart as around the beg. of 2014. Is that the case? I have a date at 1.7.14 that I think is important and wonder if it is lining up.
Thanks.
Topher
Hi Topher,
DeleteI am not really good in exact timing as regards the cycles:) I use them more like a guidance for the importance of a bottom.
So I can only look back and say - if the the cyclical bull behaves the same way(previous cycles size 69/67/62 weeks) the bottom should be the last week of January plus/minus two weeks.
Going deeper and taking in account the size of the smaller cycles - 16-18 weeks left if they do not deviate too much from the average size. And if am right that the prevailing direction is down for the cycle already, which means shorter cycles(corrections are faster usually), it is more likely minus two weeks or the first half of January 2014.
Thanks Krasi
Delete